Spectra of Hawaiian region NDBC buoy data:
Figures below courtesy of data from the National
Data Buoy Center
links to NODC buoy pages:
51101,
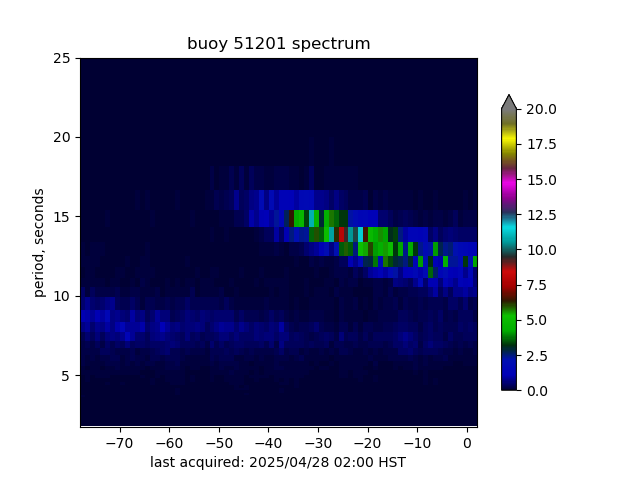
51201,
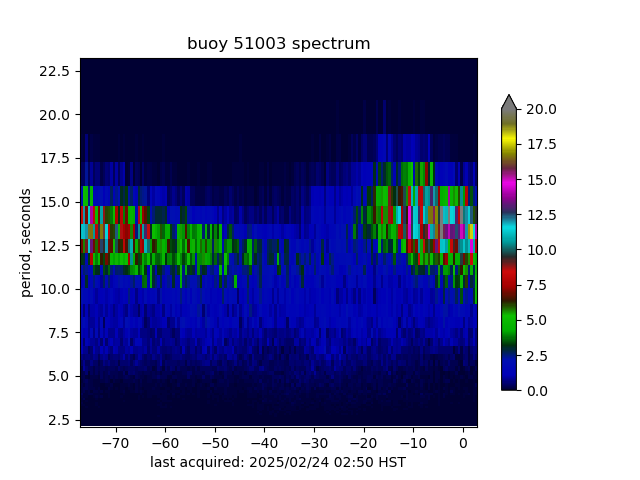
51003,
51003
All plots are made by matplotlib ,
a rapidly developing
open source alternative to matlab, written in python.
This experimental page shows non-directional spectra with the same scale.
(improvements are anticipated)
Another page exists with independently-scaled spectra
51101

|
|
51201
|
|
51003
|
|
|
|
locations

|