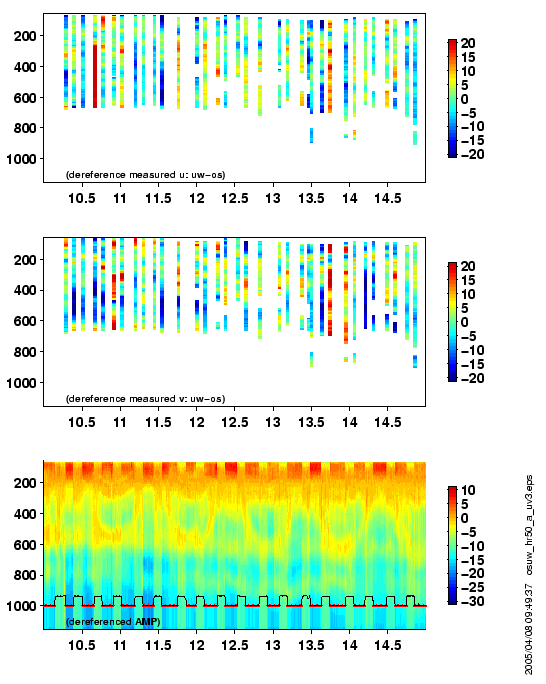
- lower stddev (gray)
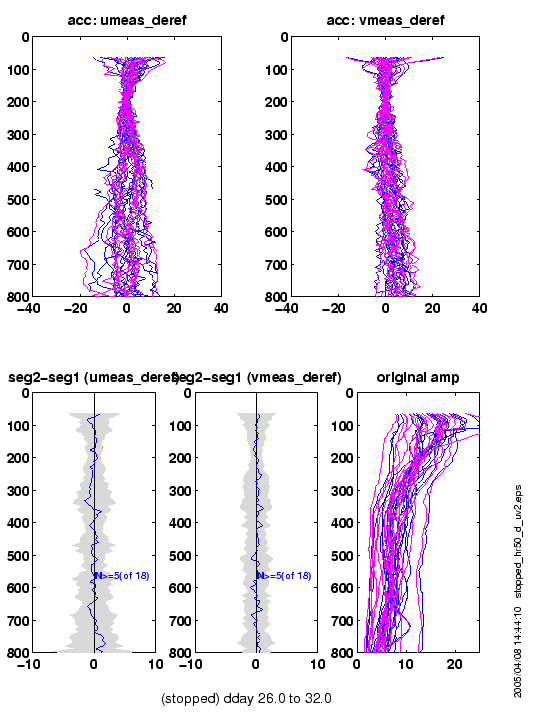
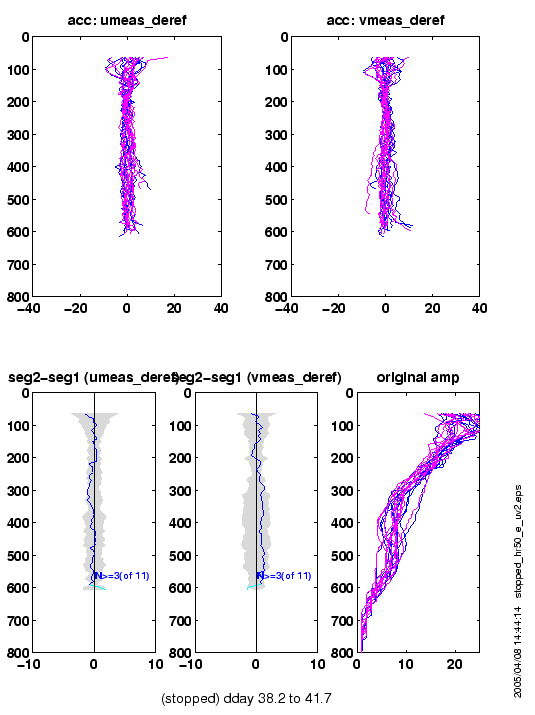
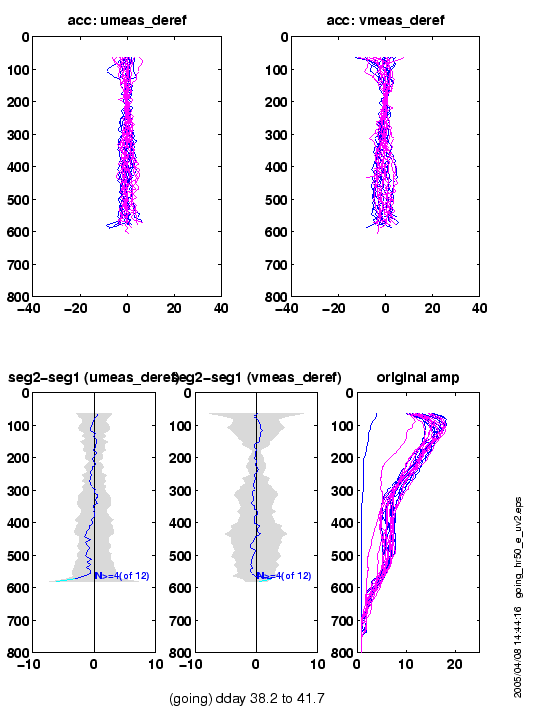
- pink and blue lines both on station
- middle stddev (gray)
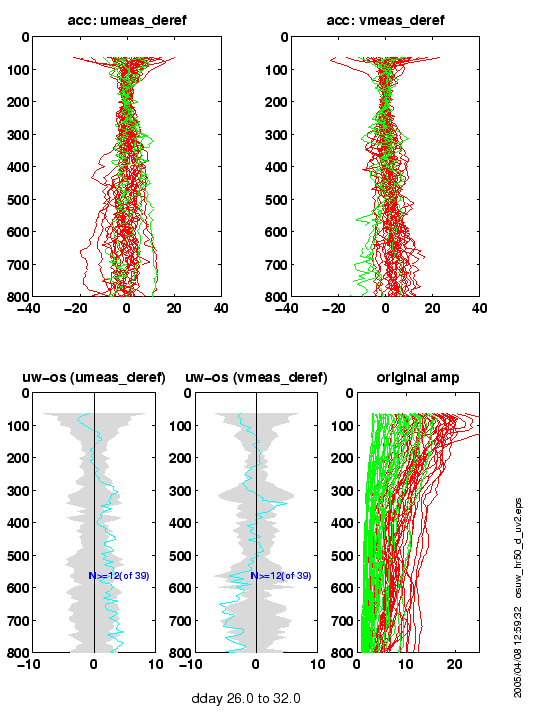
- red lines are STOPPED
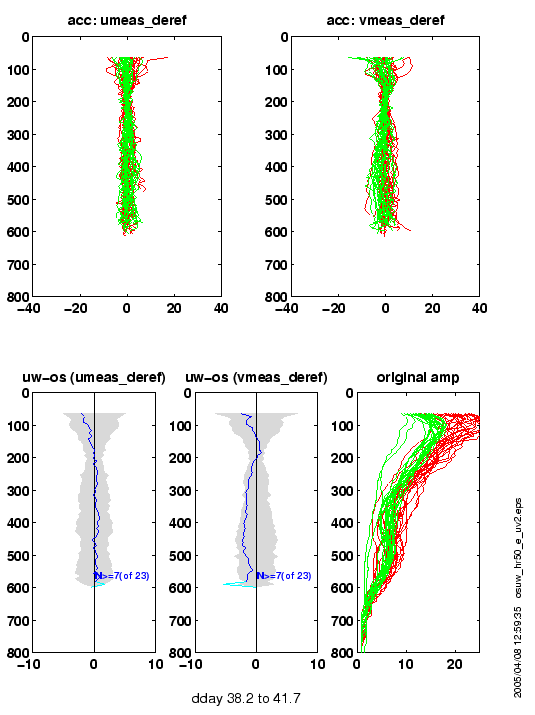
-green lines are UNDERWAY
- highest stddev (gray)
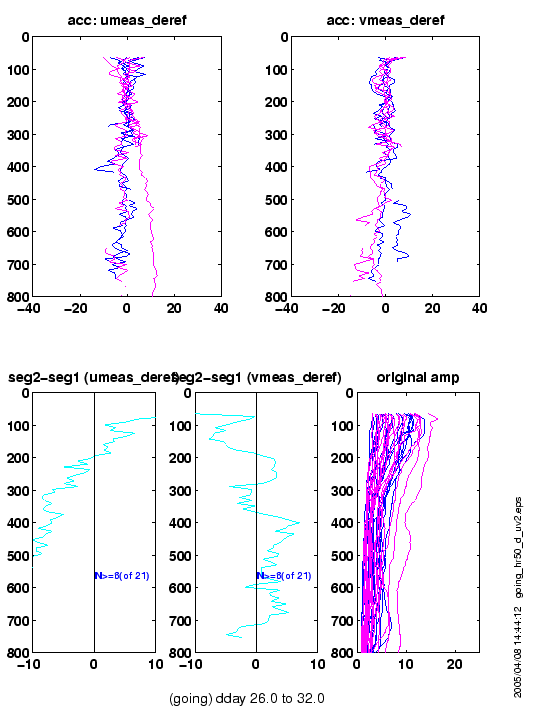
- pink and blue lines both underway
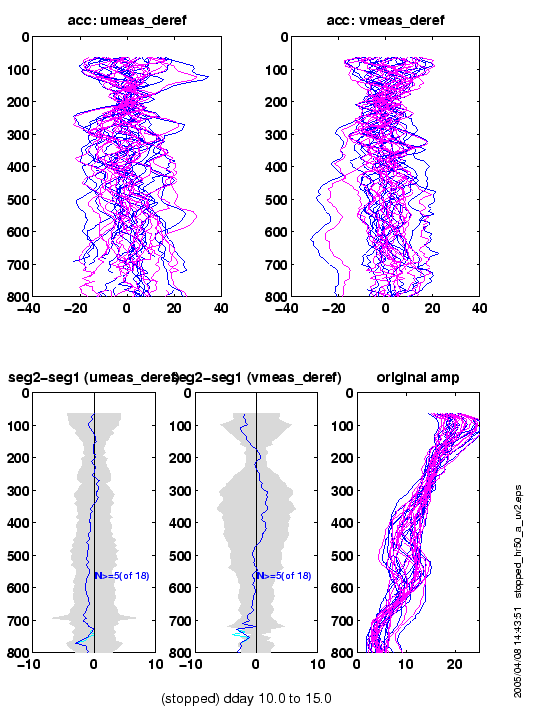
decimal
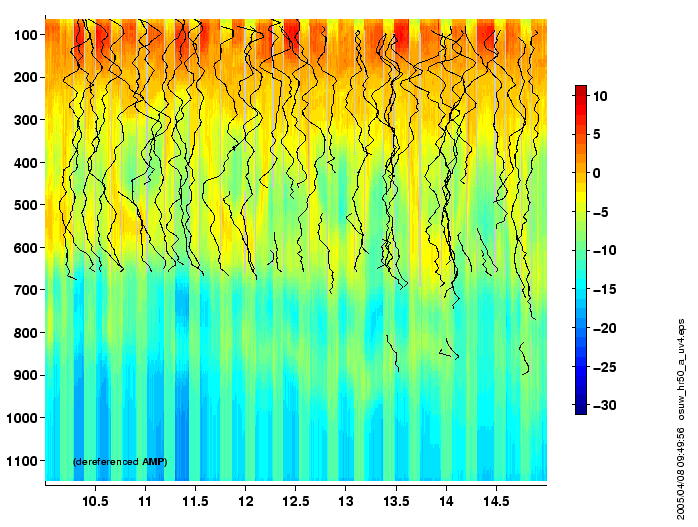
day 10-15


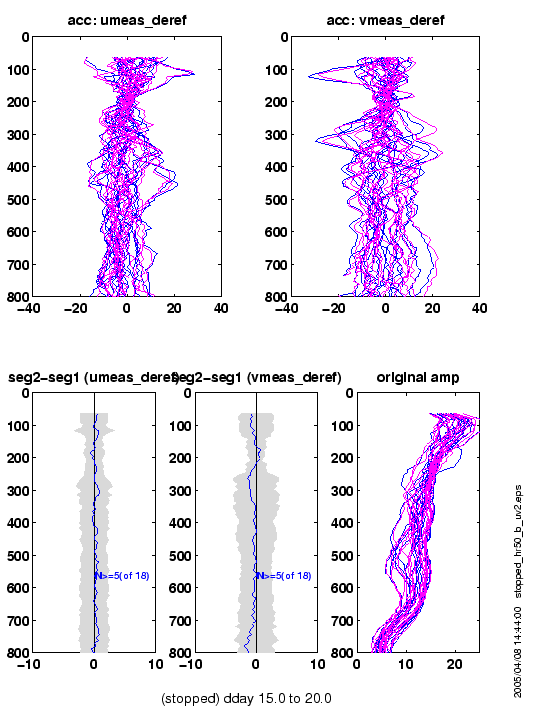
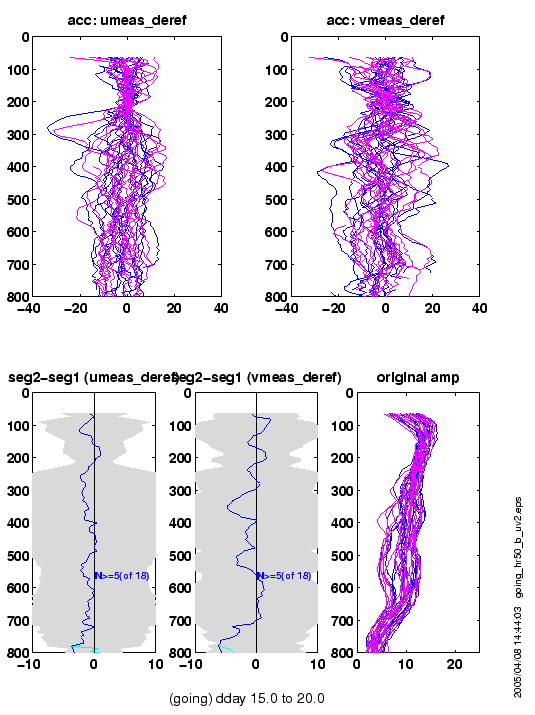
decimal
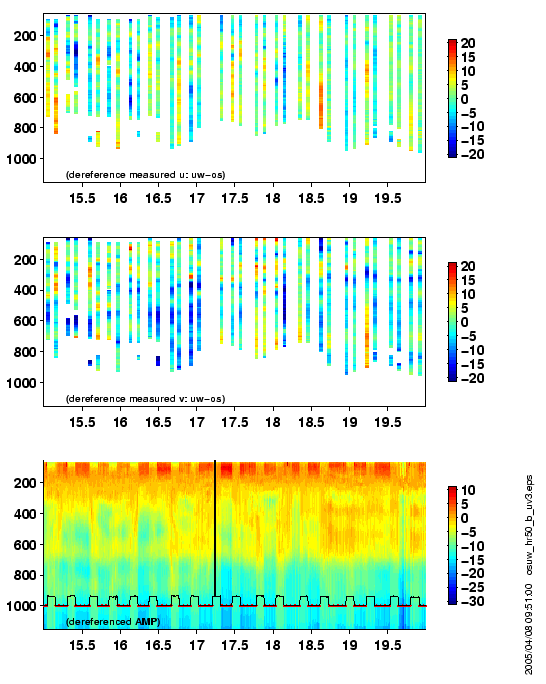
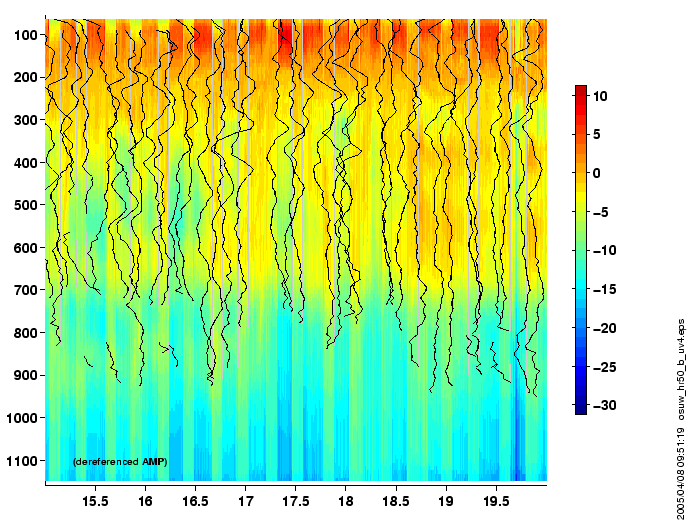
day 15-20

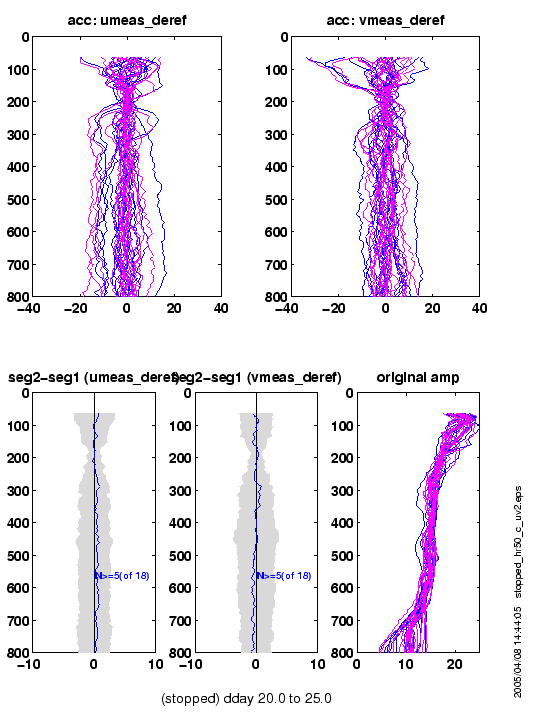
decimal
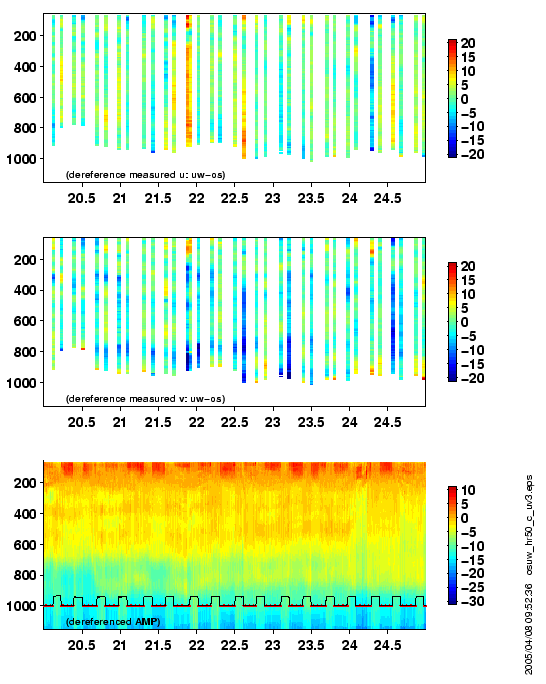
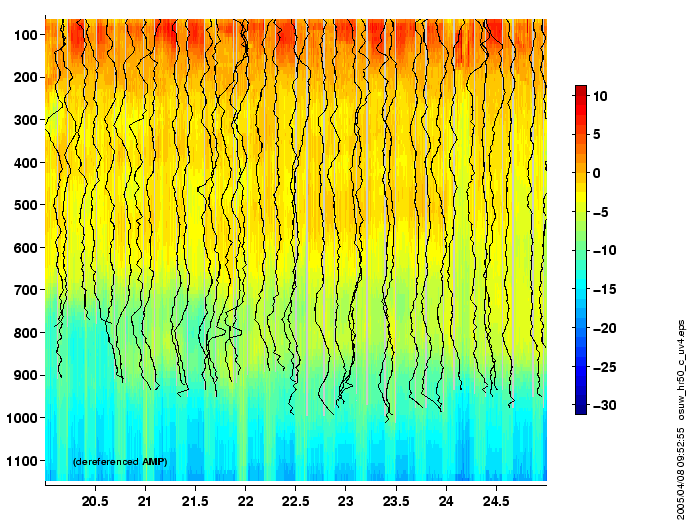
day 20-25

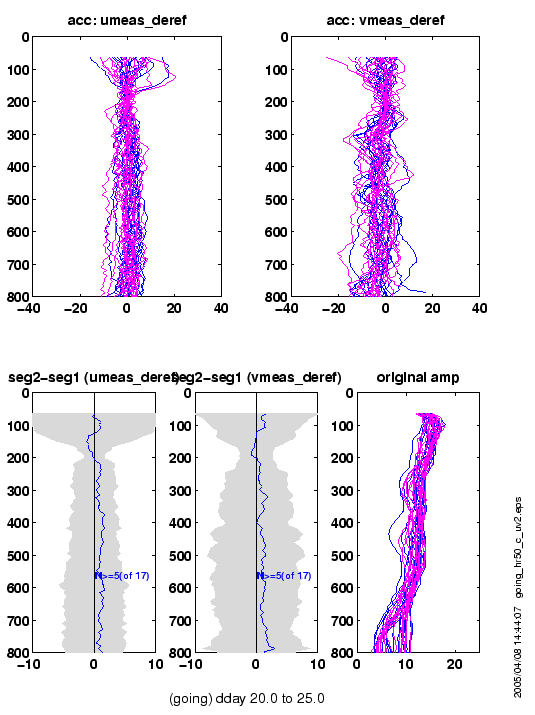
decimal
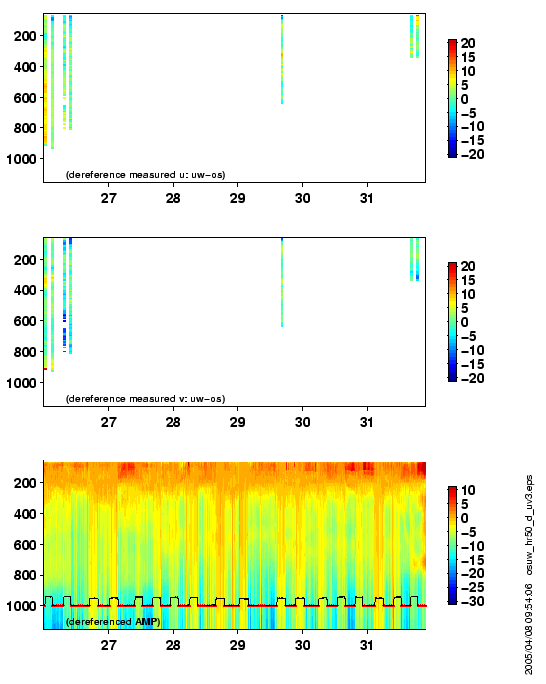
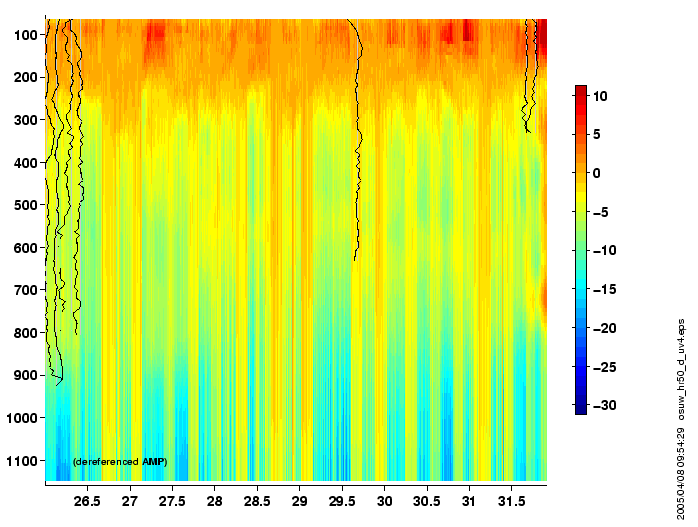
day 26-32
(bad weather, underway data trashed)
decimal
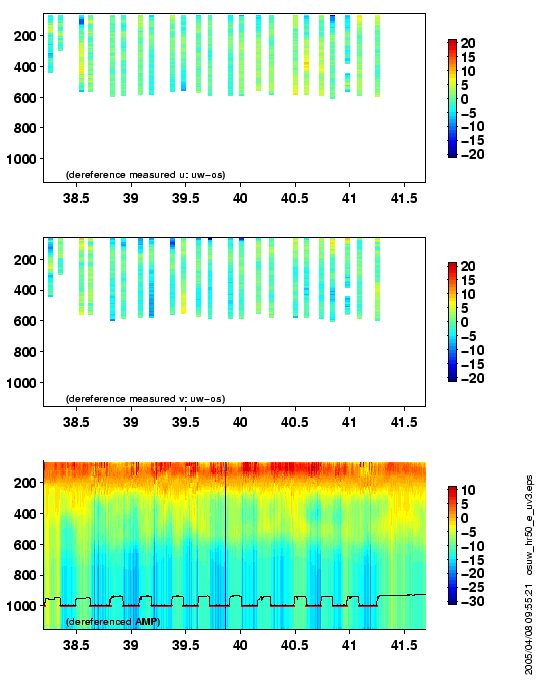
day ~38-42