ADCP data examples
Bubbles
Bubbles affect ADCP data in several ways:
- they can block sound (reducing the remaining ping to a shallow profile)
- they can cause profiles to be shorter than usual
- affected profiles can biased towards zero (acting as a reflective layer which is moving at approximately the same speed as the ship
Combining these effects, one can end up with shallow profiles that are strongly biased towards zero. After adding the ship speed to the profile (to get ocean velocities), the short profiles are strongly biased in the direction of motion, resulting in a bias in the averaged profiles.
Bubbles cause biases and reduced range in the ADCP data.
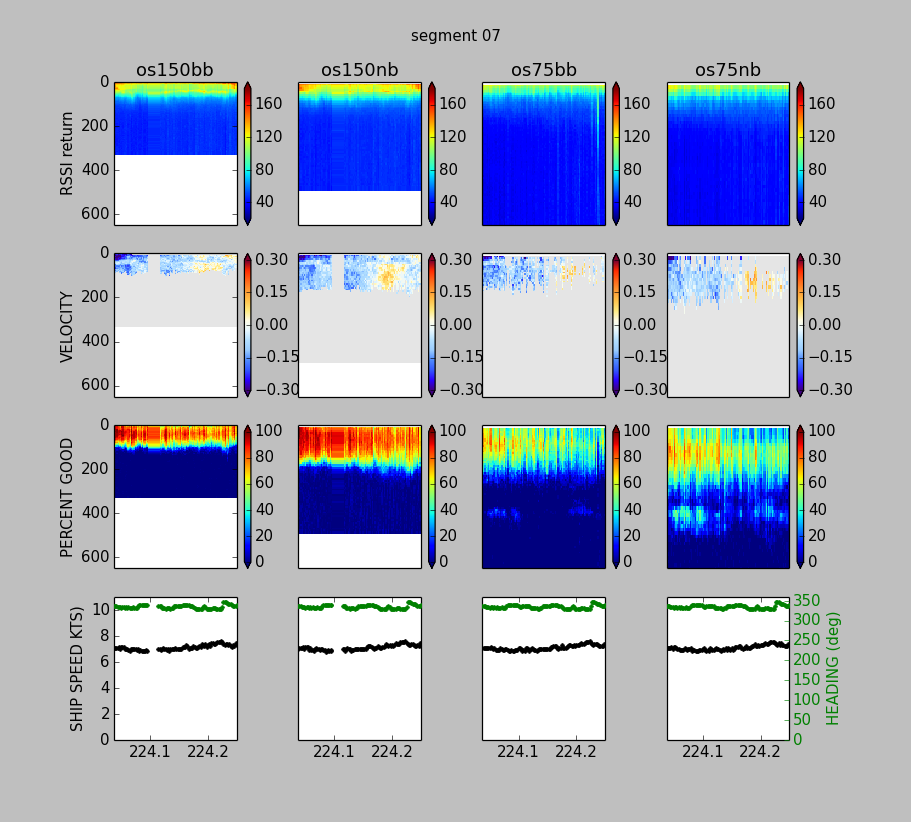
(above): This example shows the data range for both instruments (OS150 and OS75) and both ping types (Broadband and Narrowband) when the ship was travelling at about 10kts during a period of deteriorating weather. The ship was heading NNW and the wind was astern. Wind speed was 10-15kts during the part shown, but increased later in the day.
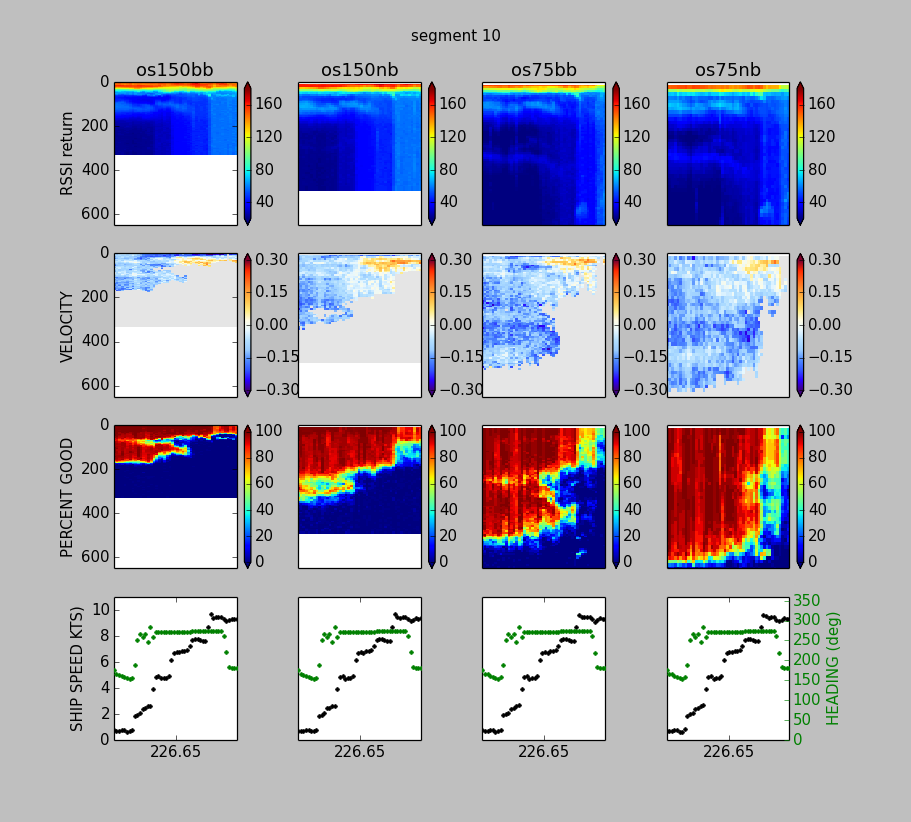
(above): This example shows a speed test, with a clear decrease in range as ship speed increased. The next two plots also look at this time range.
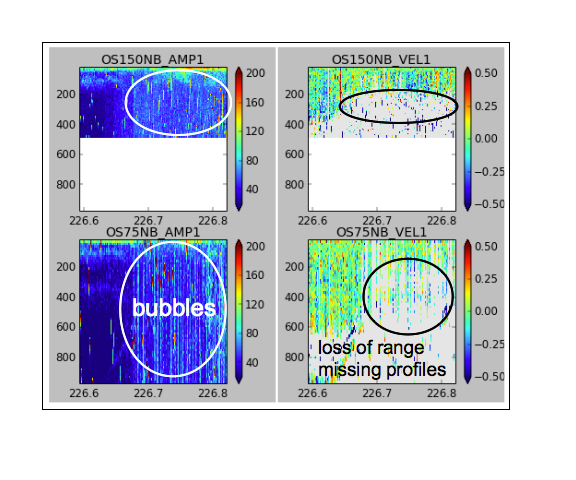
(above): This is a single ping look at the data from the previous example, as the ship speed increases and the bubbles kick in. The velocities have had a mean removed, to center them around zero.
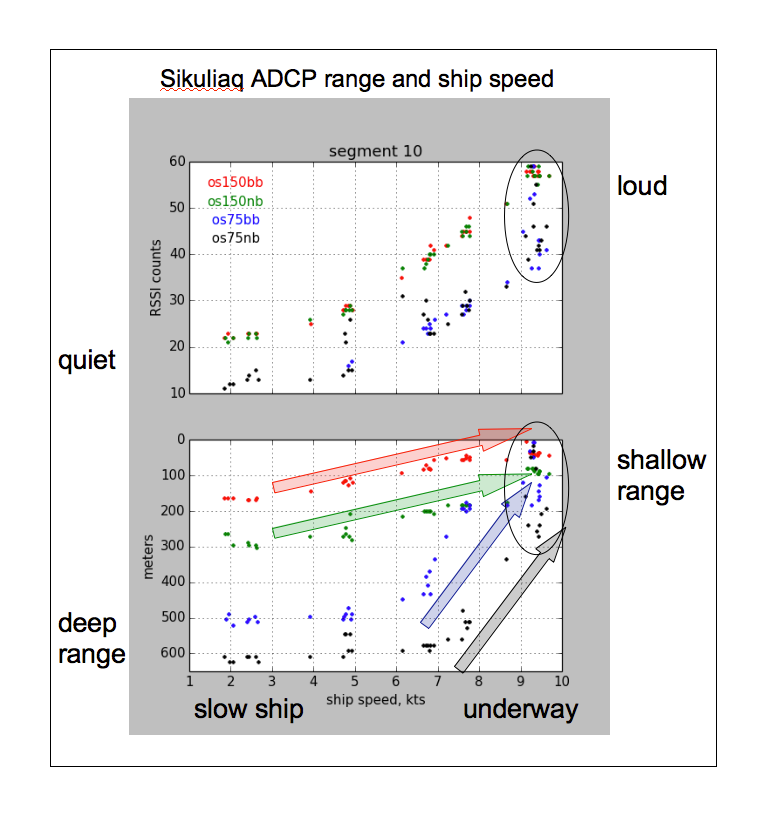
(above) Speed test: background noise increases with speed, range decreases for both instruments. The OS75 is badly affected starting around 6.5kts for this test. The actual ship speed at which the OS75 range plummets, will depend in scattering and sea state.
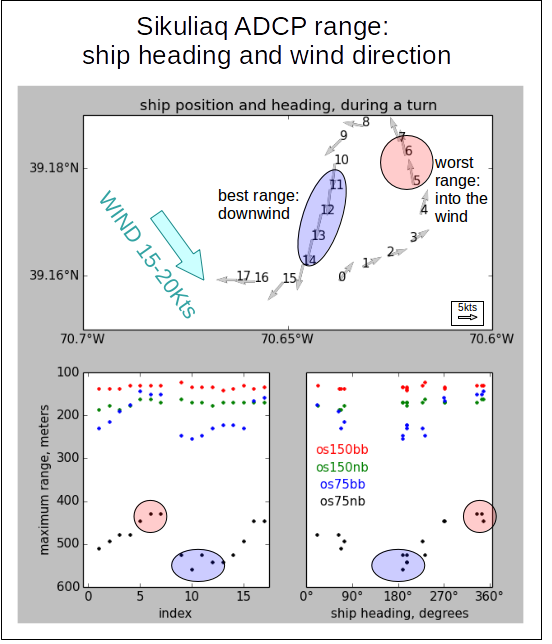
(above) Heading test: range varied as a function of heading, with a decrase in range in both instruments, using both ping types.
Interference Examples
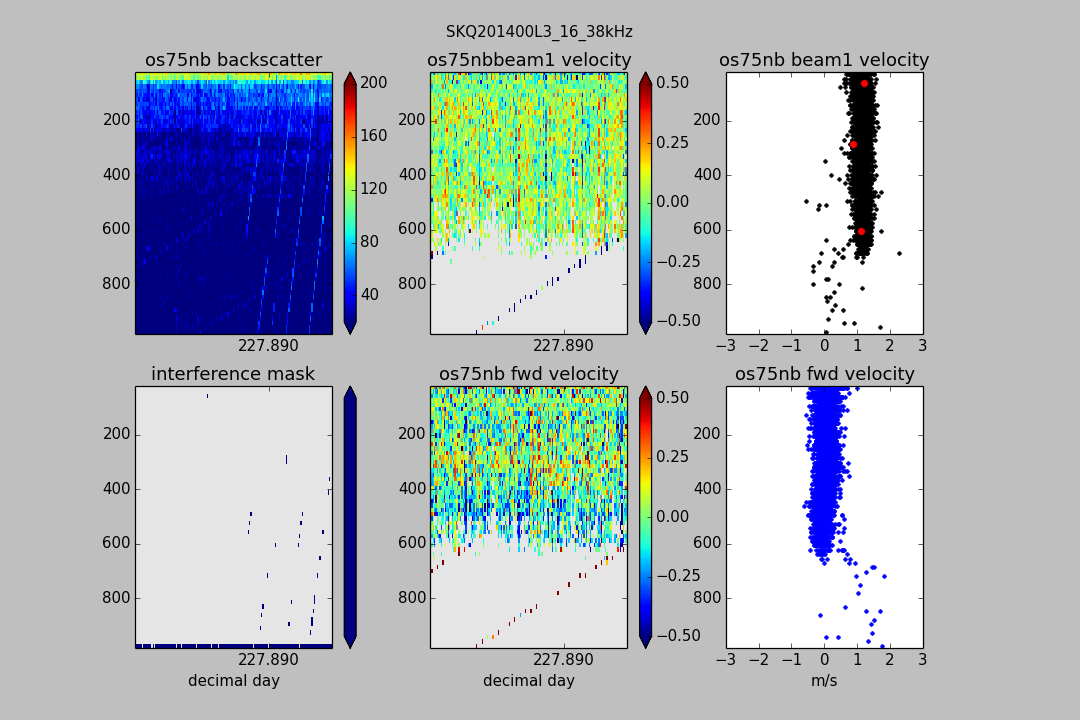
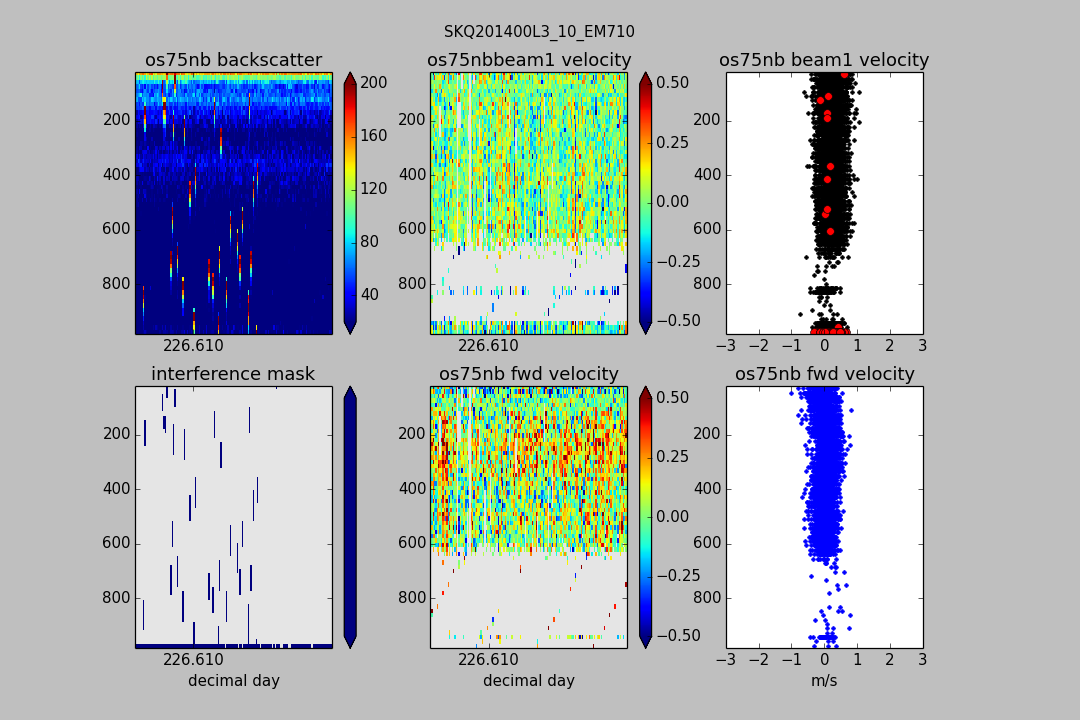
The following figures are examples of acoustic interference on ADCP data. They are all laid out with the same scheme:
- upper left: beam 1 backscatter (“RSSI”) (color panel plot)
- lower left: “interference mask” created from amplitude spikes (eg. in beam1 backscatter)
- upper center: beam 1 velocity (color panel plot)
- lower center: final computed ocean velocity (oriented in ship's forward direction)
- upper right: beam velocity plotted versus depth; “bad” values (as determined from the “interference mask” are plotted in red
- lower right: final computed ocean velocity plotted versus depth
This treatment is applied to all beams, before the transformation to horizontal and vertical coordinates. None of the data flagged with red dots will be used in CODAS processing. Additional single-ping editing is applied to the velocities after they are converted into horizontal velocities and rotated into earth coordinates.
The next 3 plots show annotated versions of specific interference.
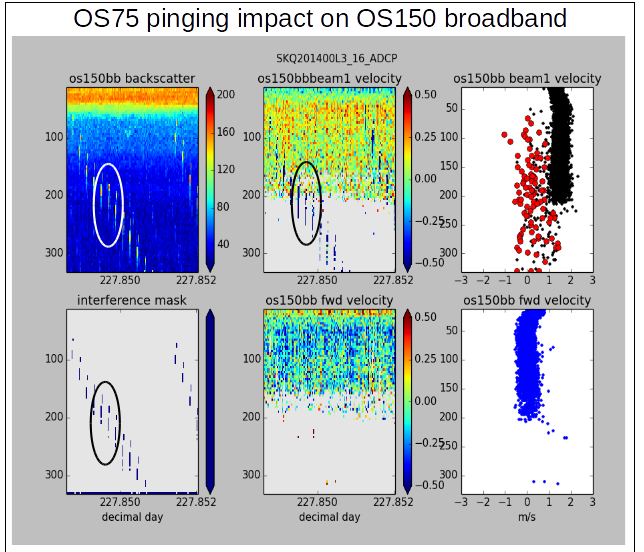
(above) OS75 interference is visible in amplitude and velocity of the OS150 data.
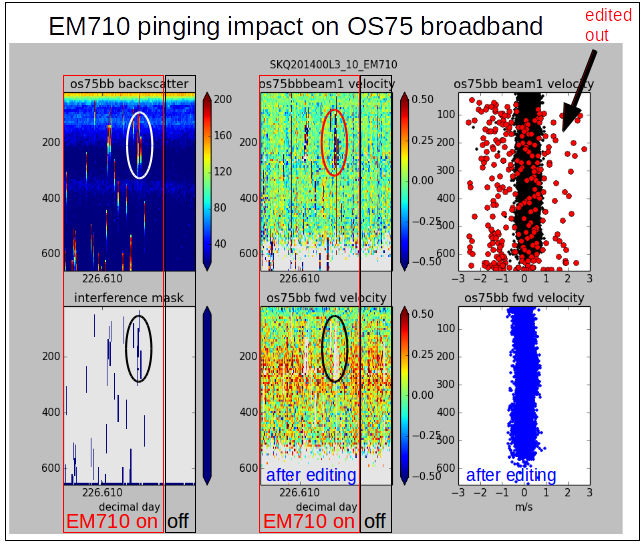
(above) EM710 interference is visible in the amplitude and velocity of the OS75 broadband data.
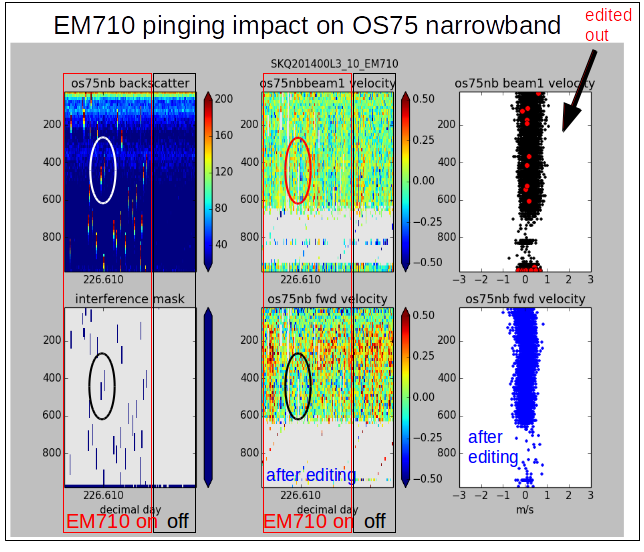
(above) EM710 interference is visible in amplitude but not velocity of the OS75 narrowband data.
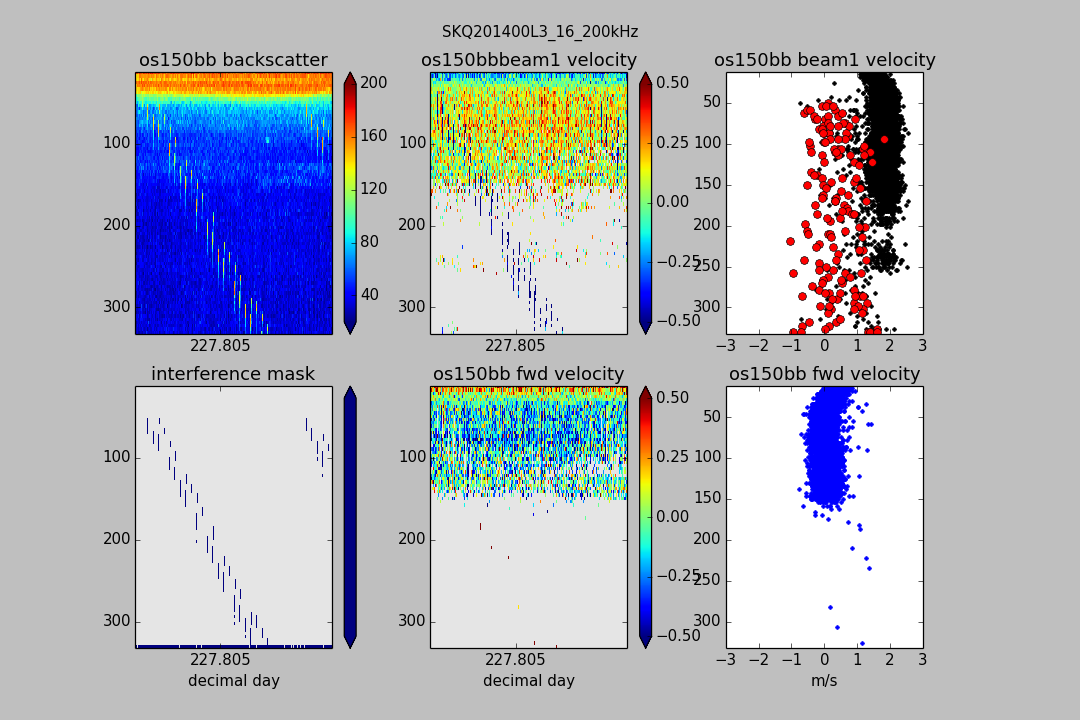
(above) EK60 200kHz interference on os150bb
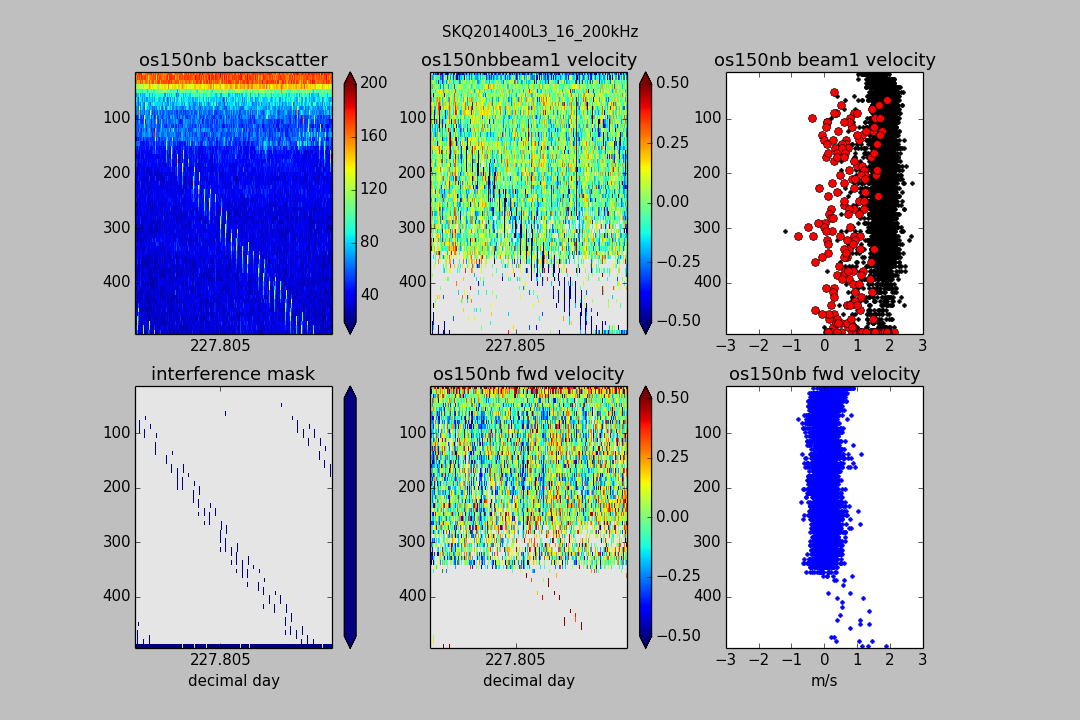
(above) EK60 200kHz interference on os150nb
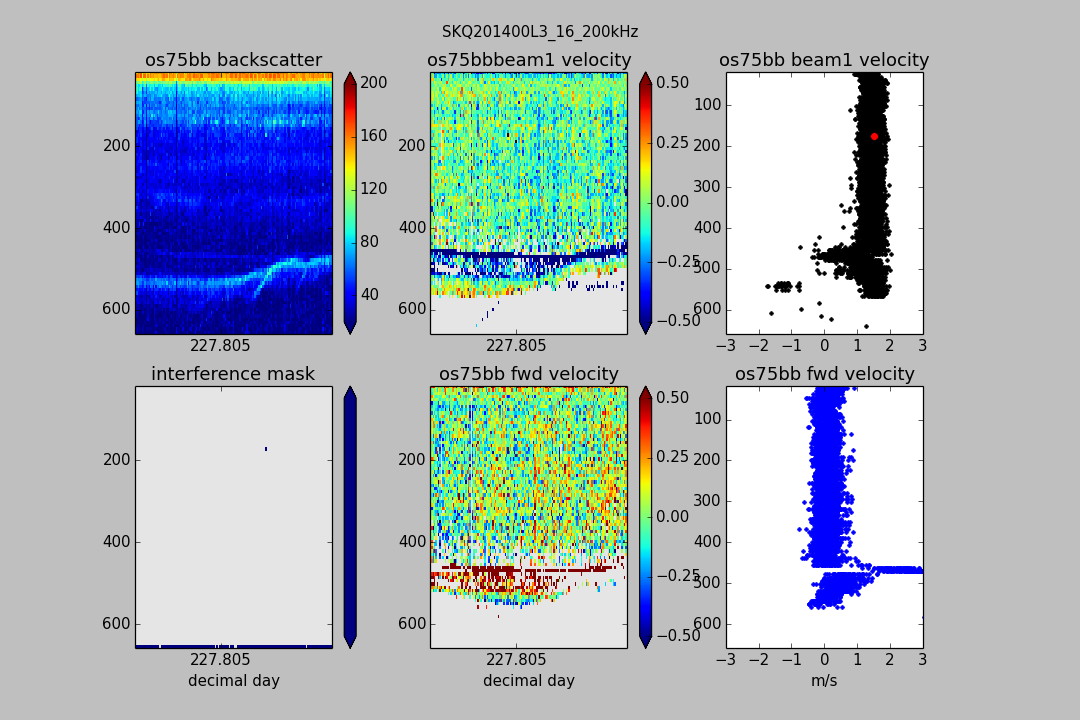
(above) EK60 200kHz interference on os75bb
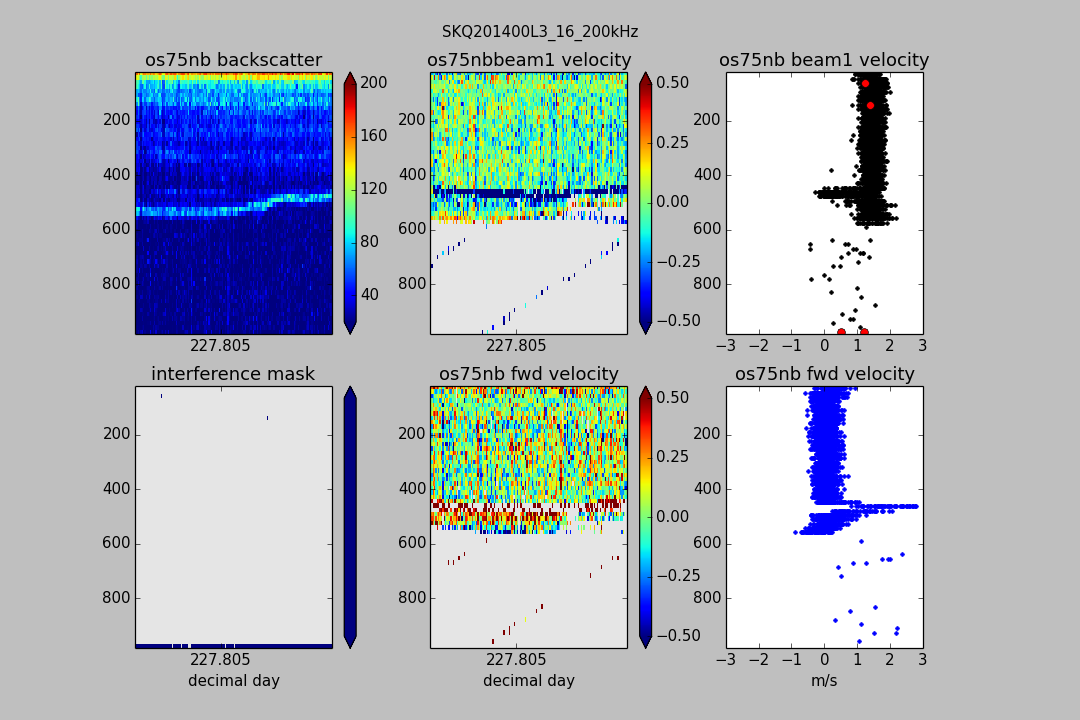
(above) EK60 200kHz interference on os75nb
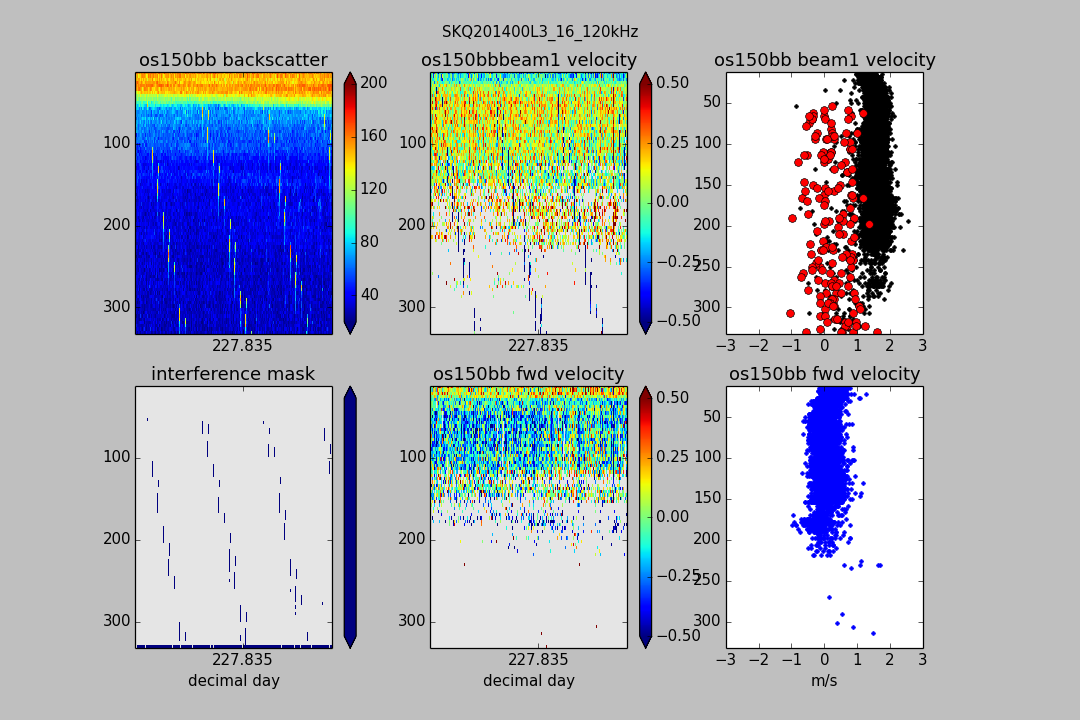
(above) EK60 120kHz interference on os150bb
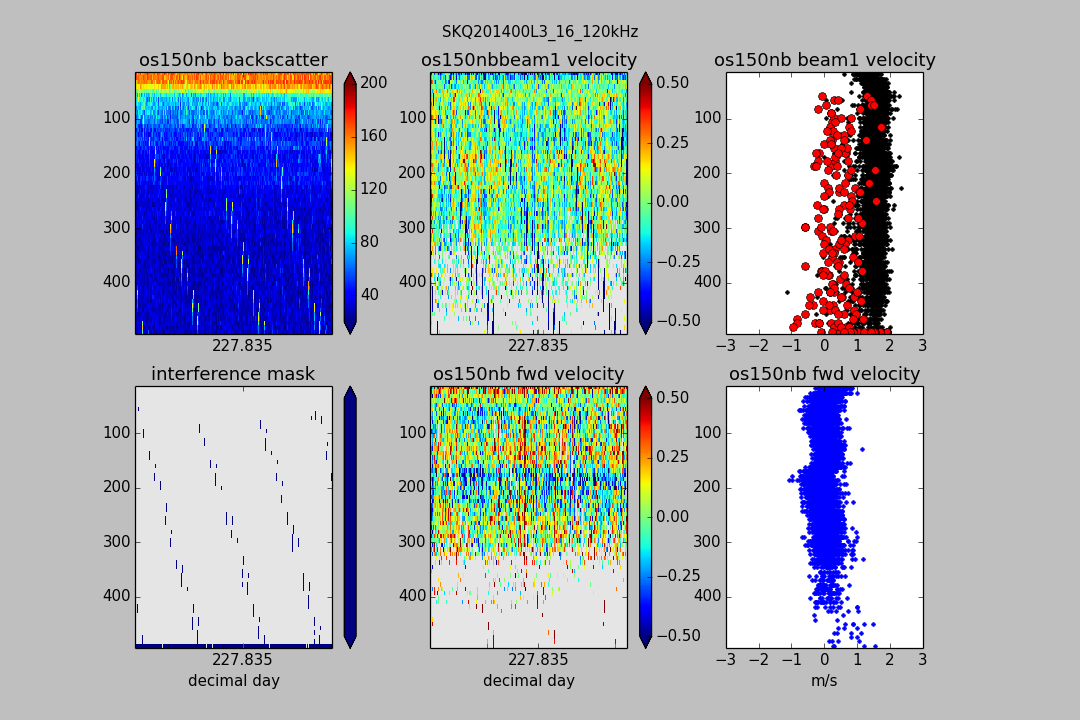
(above) EK60 120kHz interference on os150nb

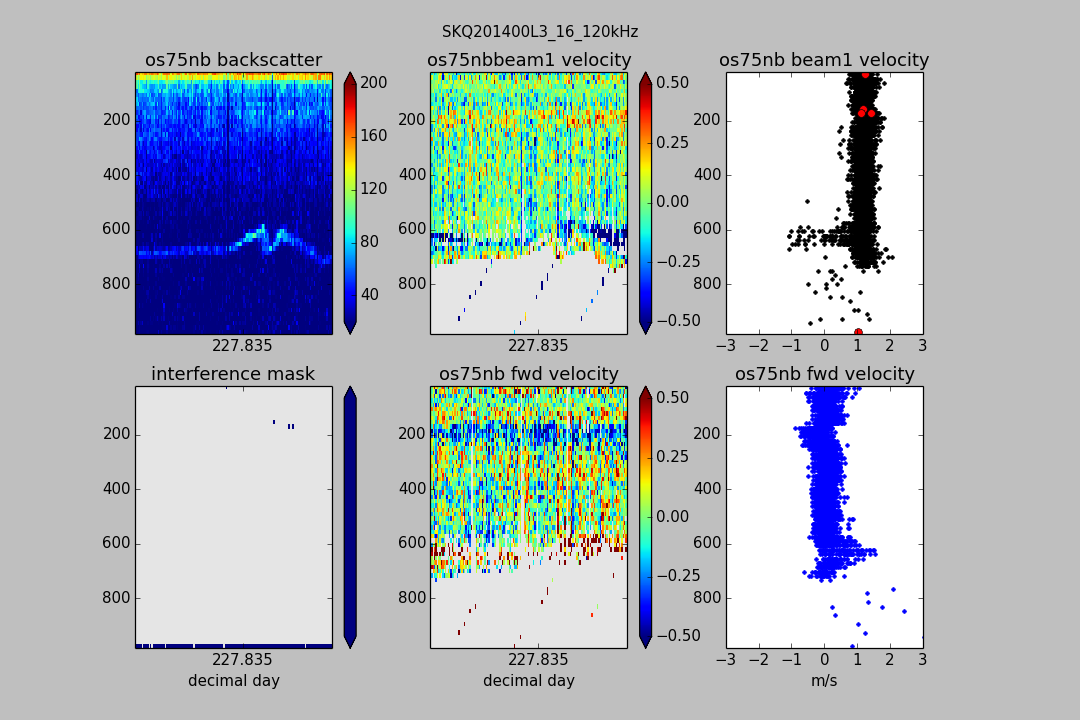
(above) EK60 120kHz interference on os75bb
(above) EK60 120kHz interference on os75nb
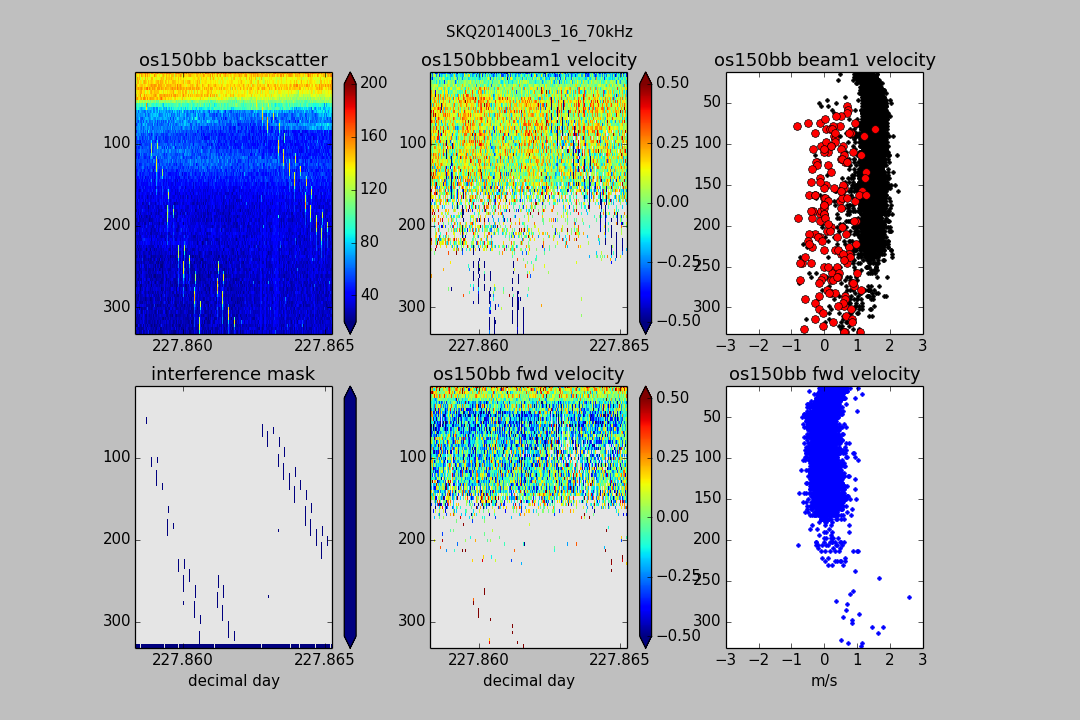
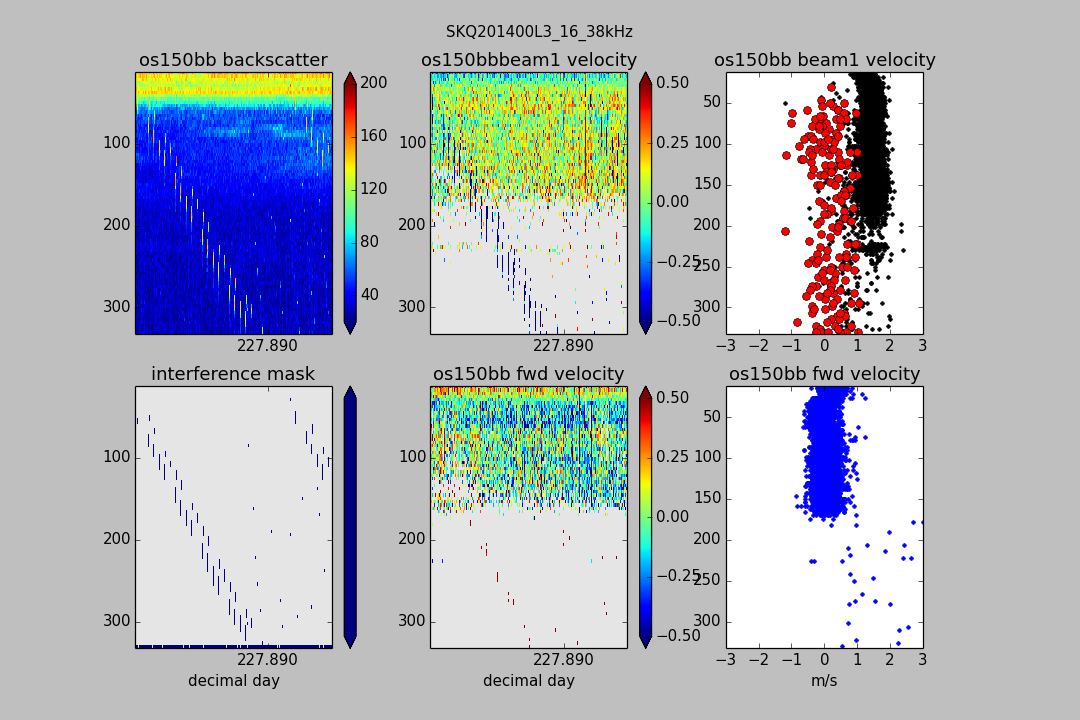
(above) EK60 70kHz interference on os150bb
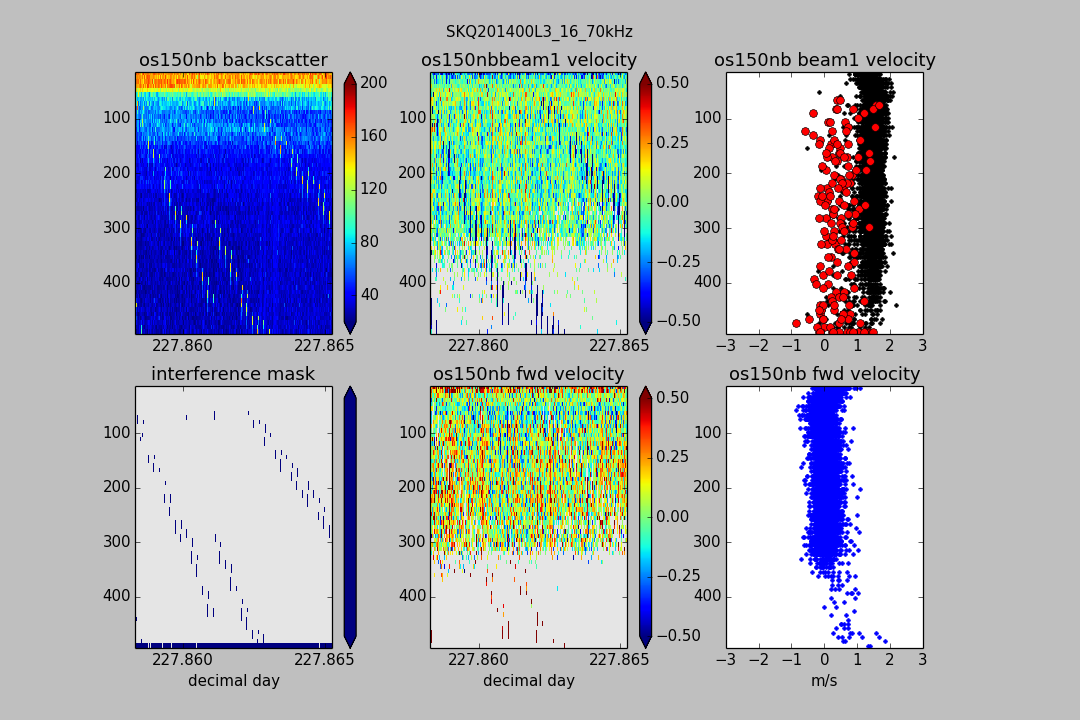
(above) EK60 70kHz interference on os150nb

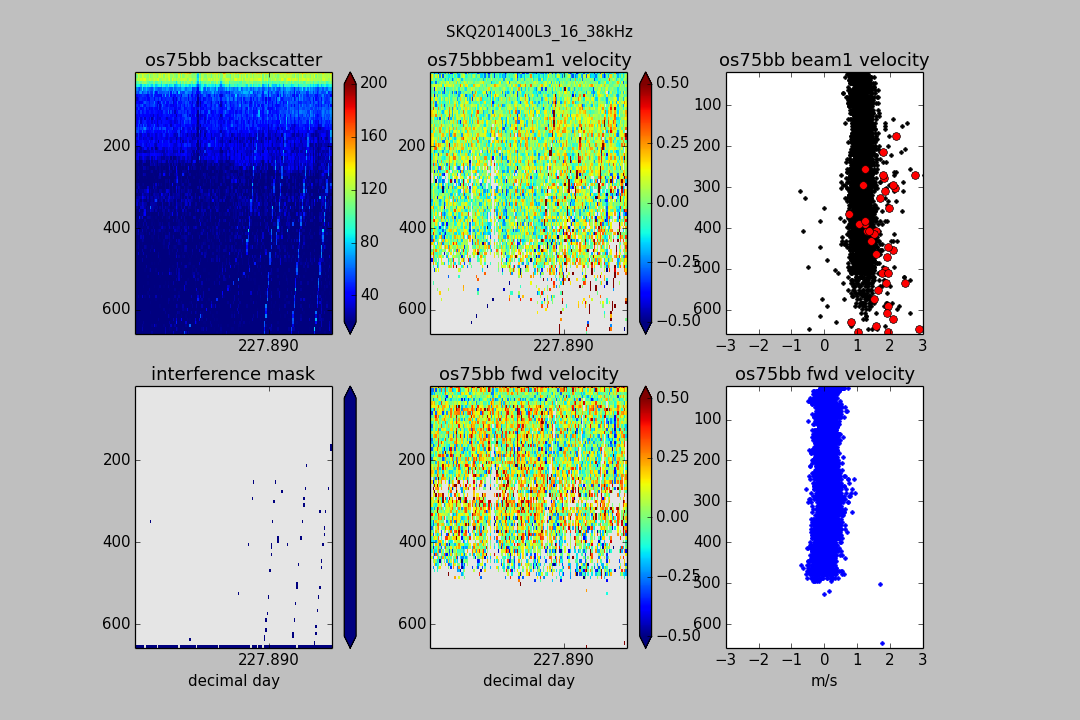
(above) EK60 70kHz interference on os75bb
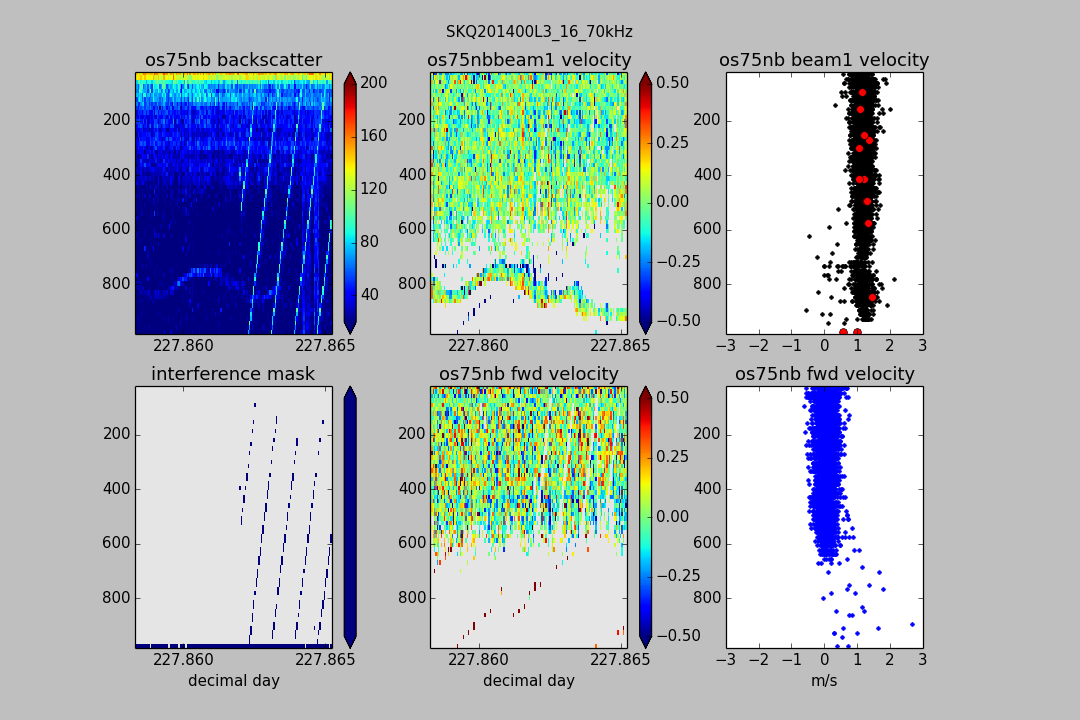
(above) EK60 70kHz interference on os75nb
(above) EK60 38kHz interference on os150bb

(above) EK60 38kHz interference on os150nb
(above) EK60 38kHz interference on os75bb
(above) EK60 38kHz interference on os75nb
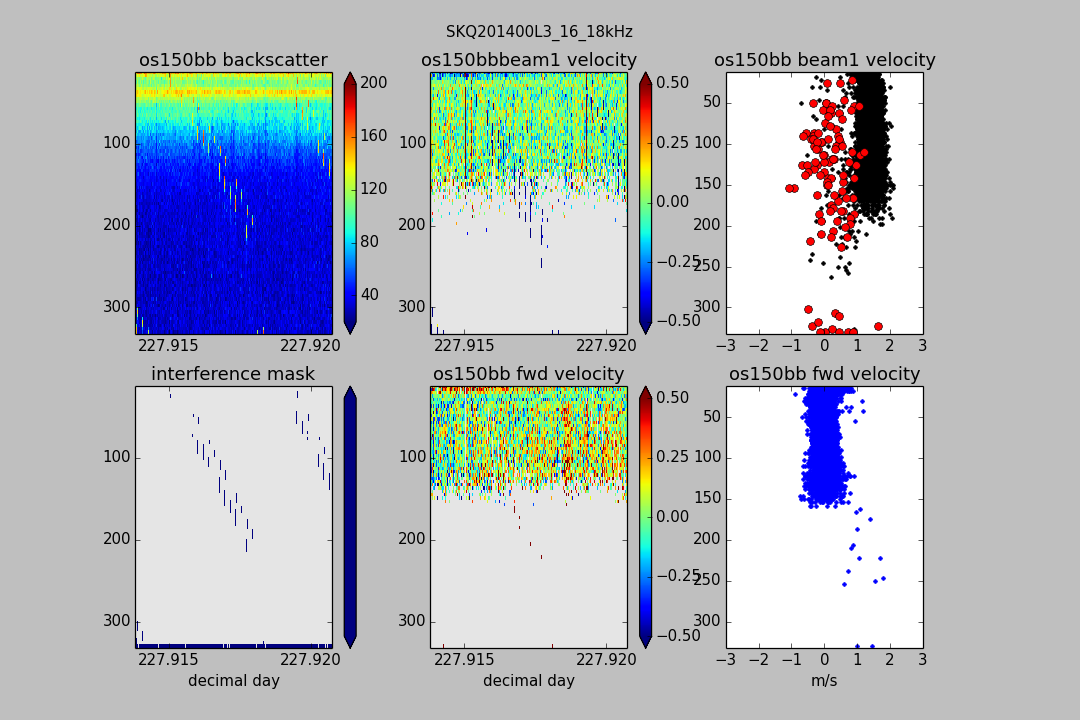
(above) EK60 18kHz interference on os150 broadband
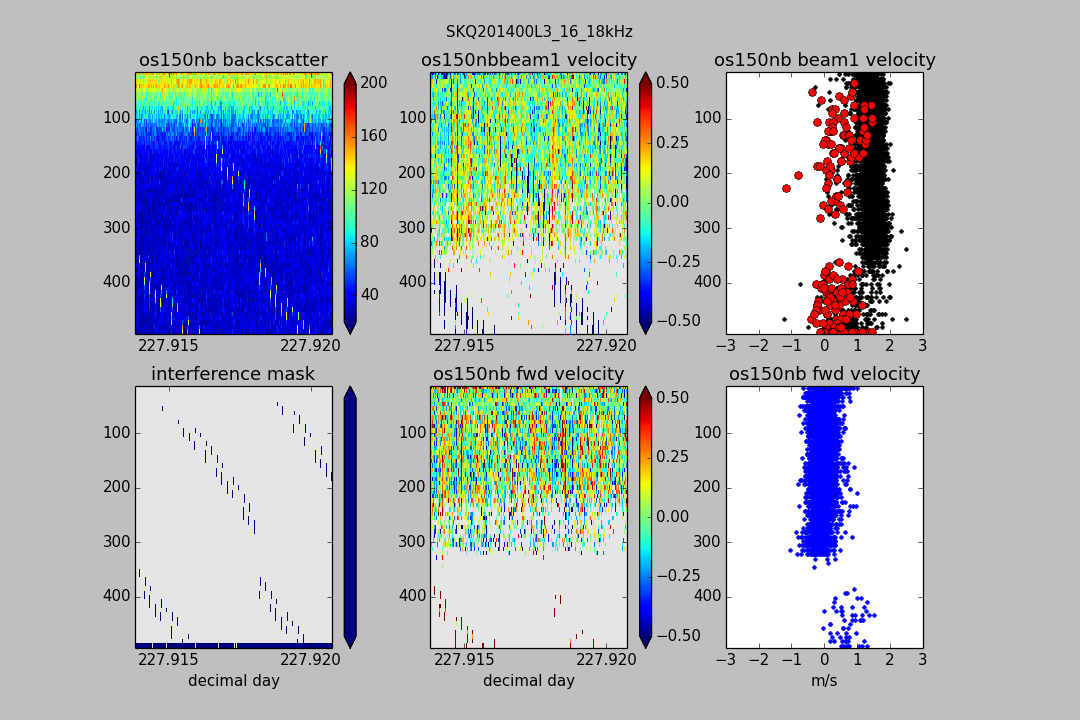
(above) EK60 18kHz interference on os150 narrowband
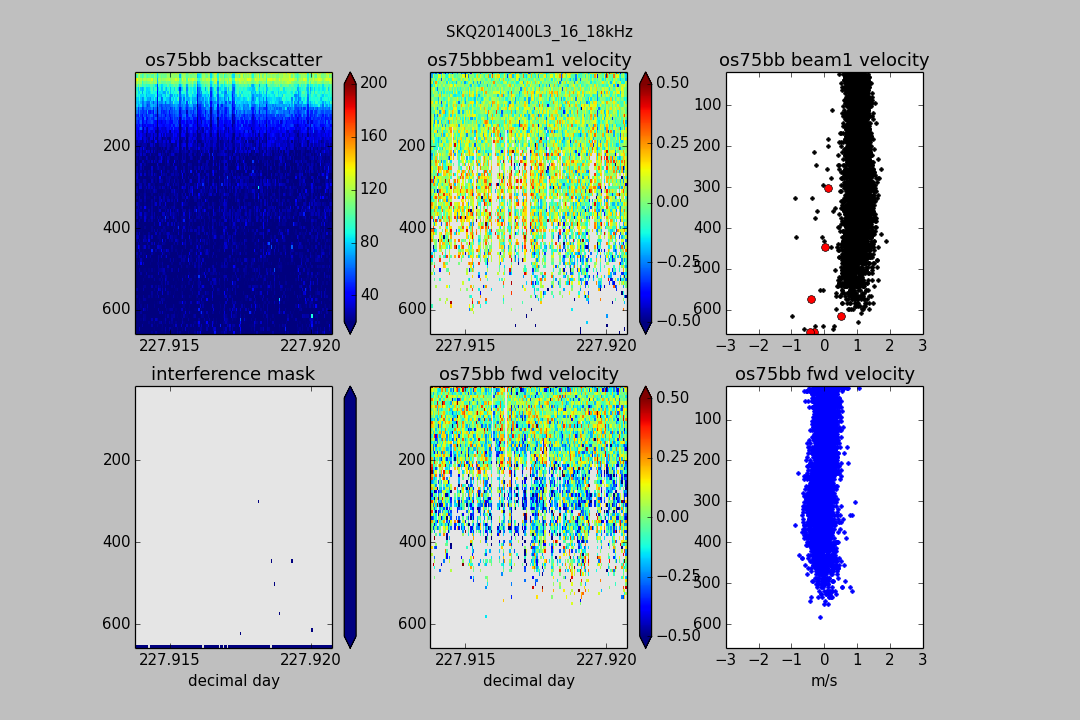
(above) EK60 18kHz interference on os75 broadband
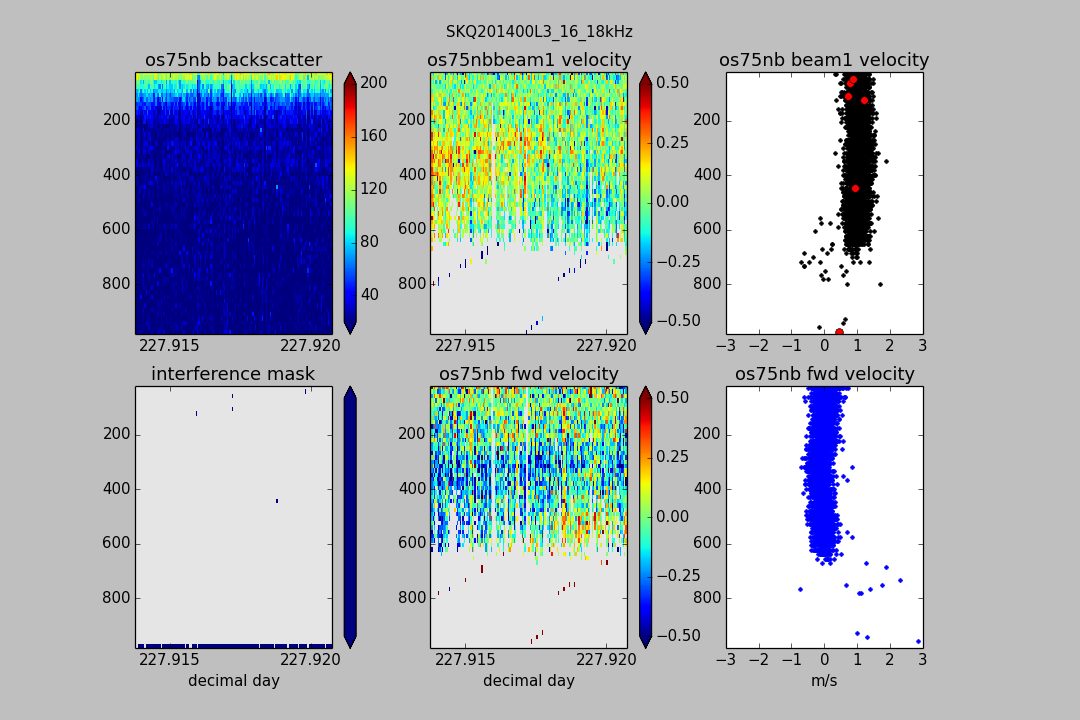
(above) EK60 18kHz interference on os75 narrowband
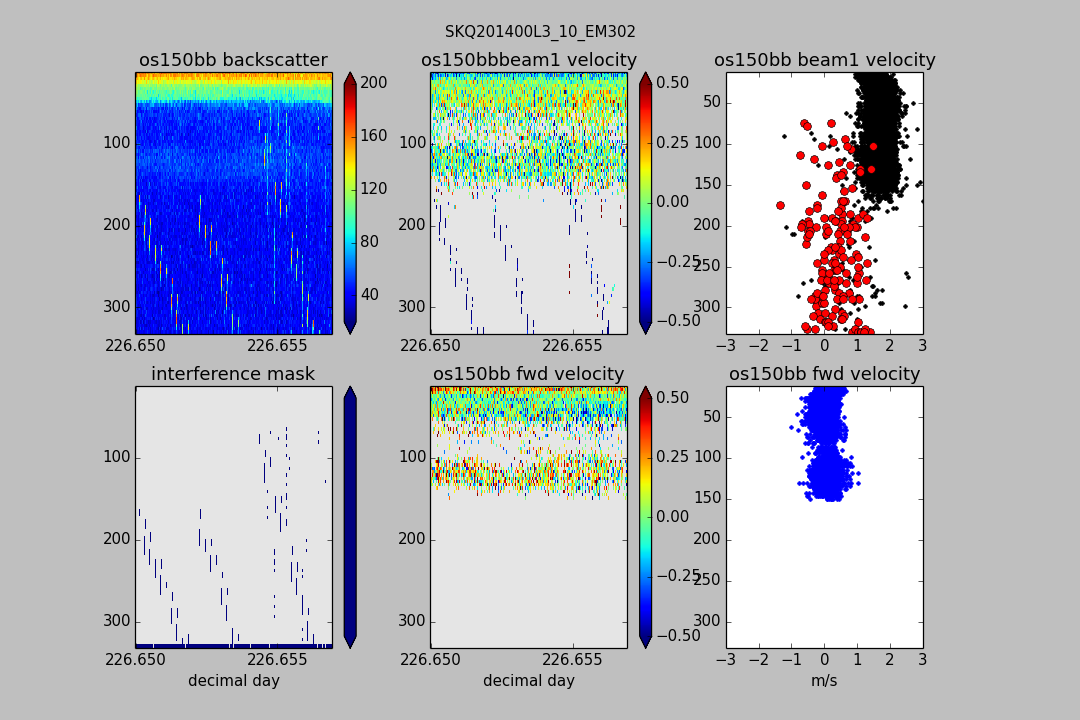
(above) EM302 interference on os150bb
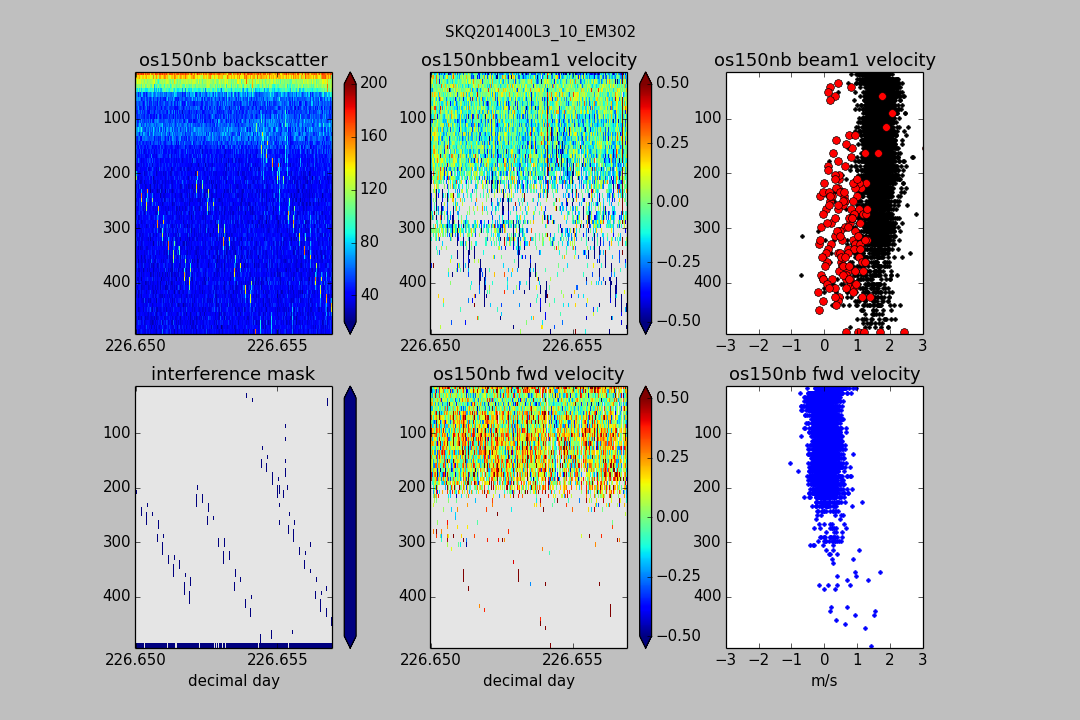
(above) EM302 interference on os150nb
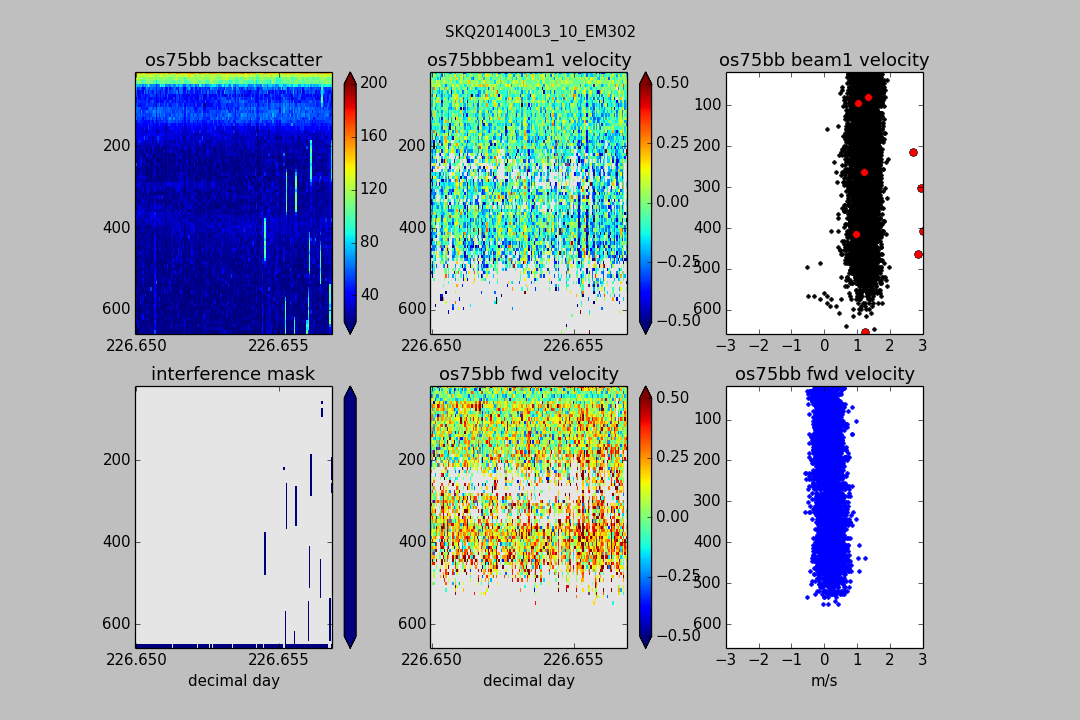
(above) EM302 interference on os75bb
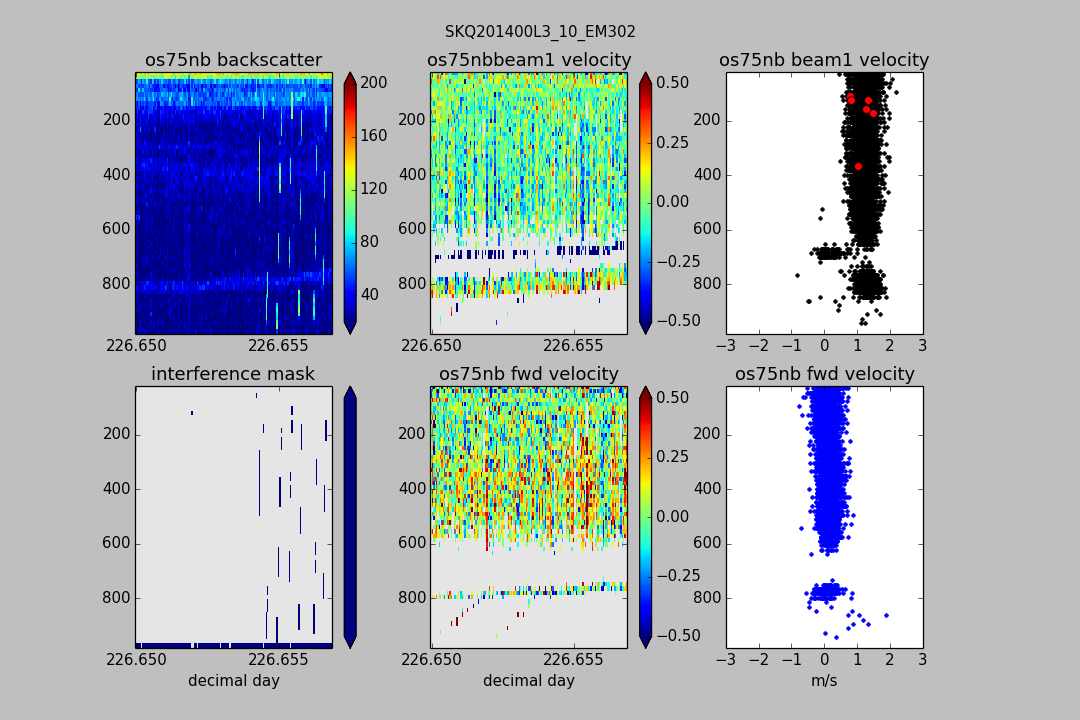
(above) EM302 interference on os75nb
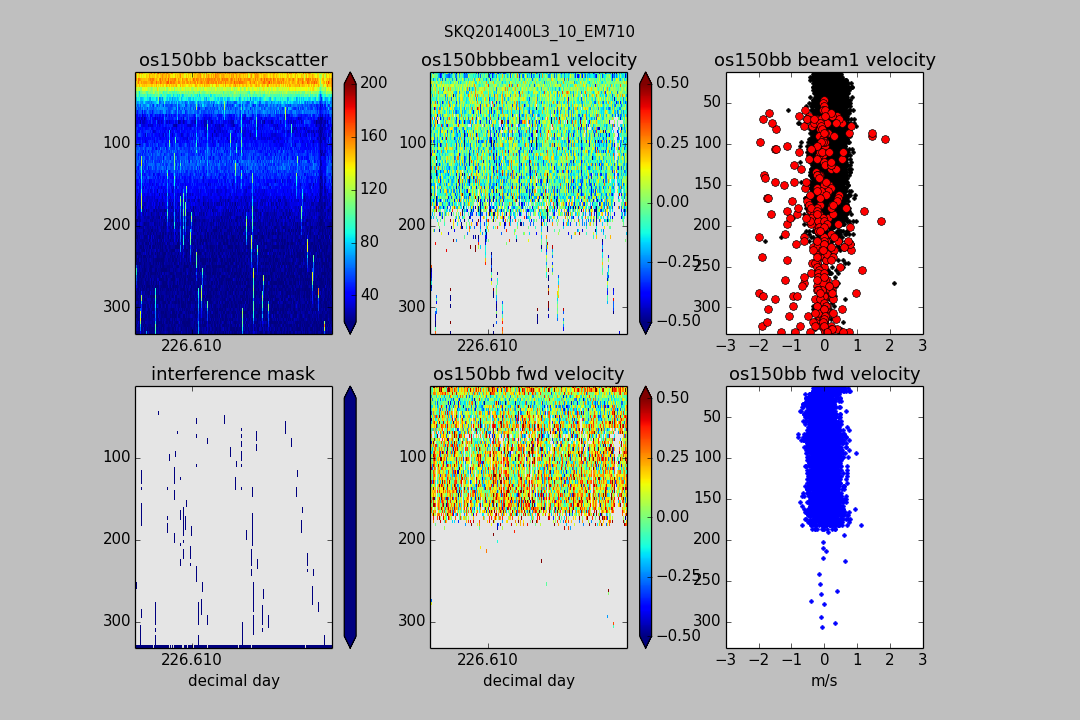
(above) EM710 interference on os150bb
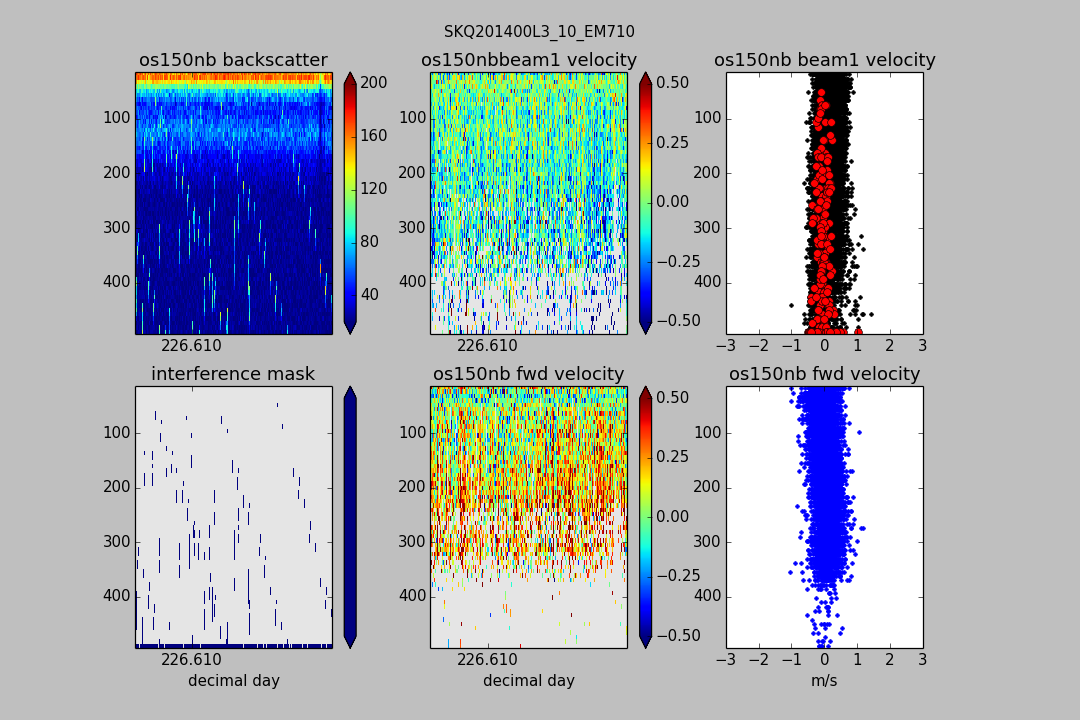
(above) EM710 interference on os150nb
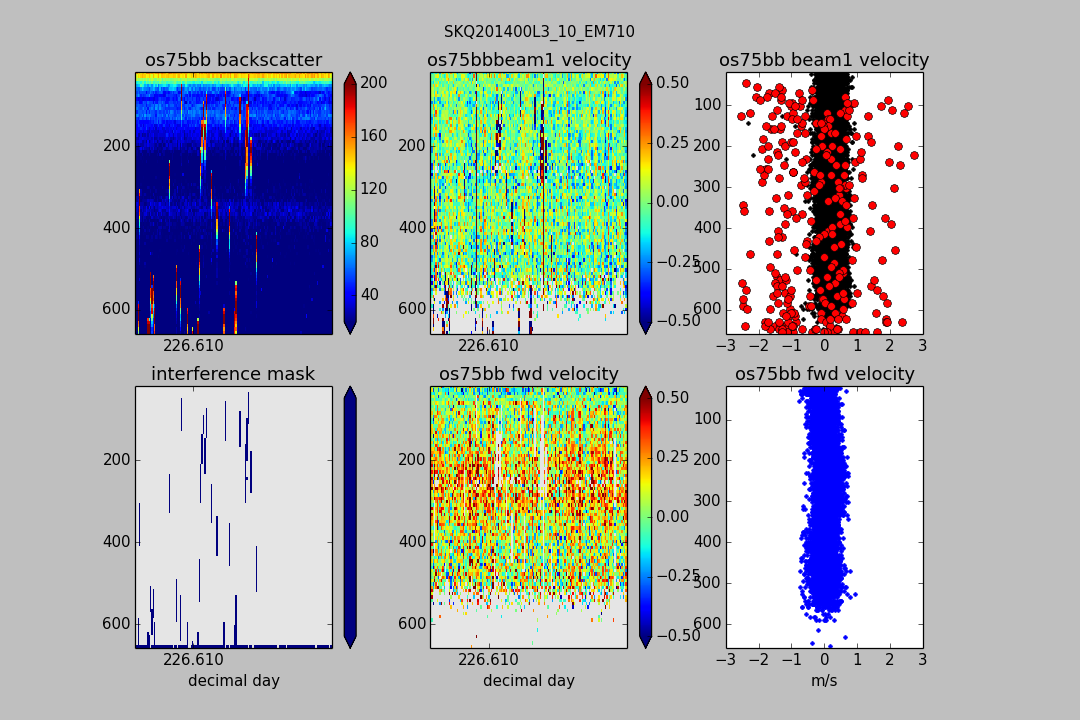
(above) EM710 interference on os75bb
(above) EM710 interference on os75nb
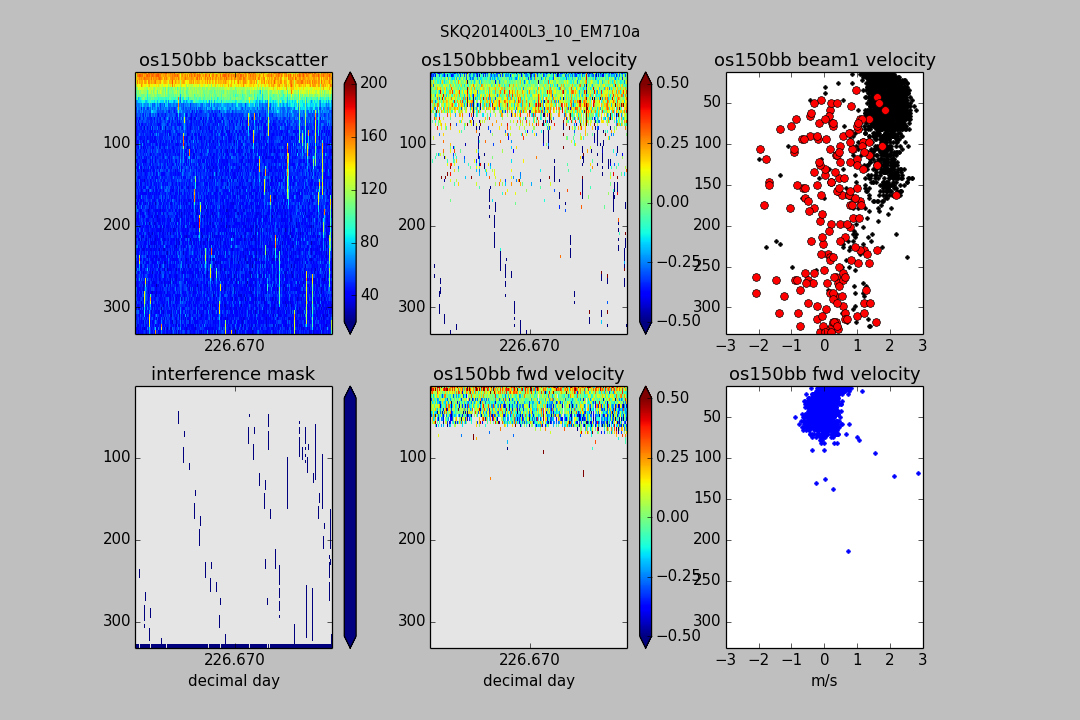
(above) EM710a interference on os150bb
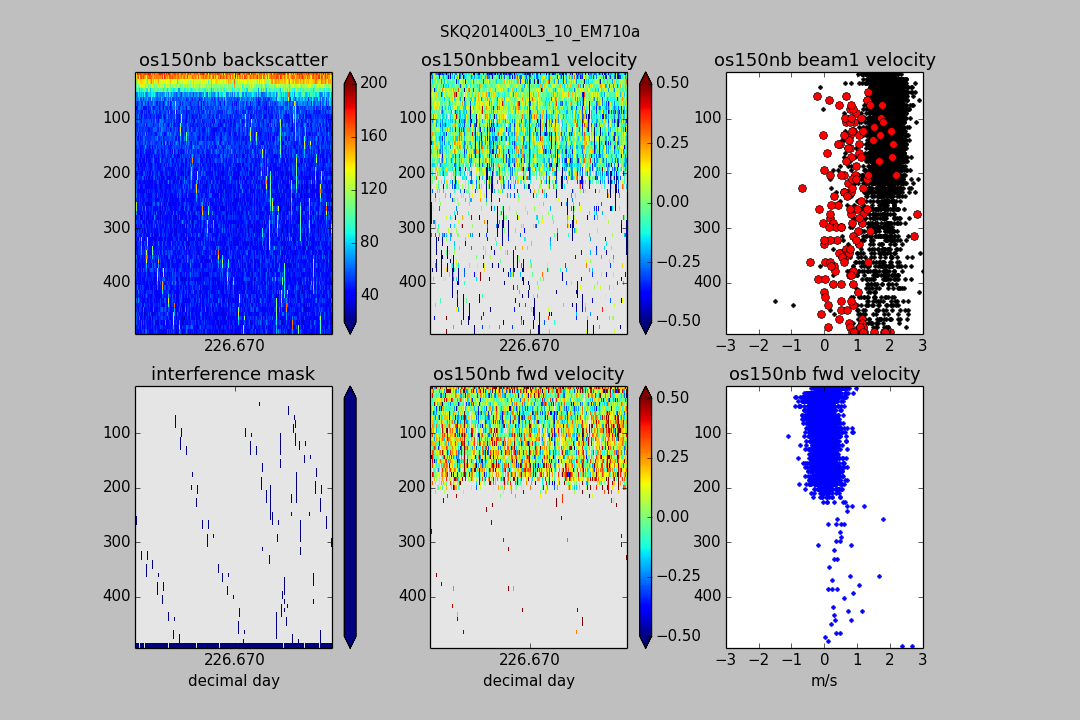
(above) EM710a interference on os150nb
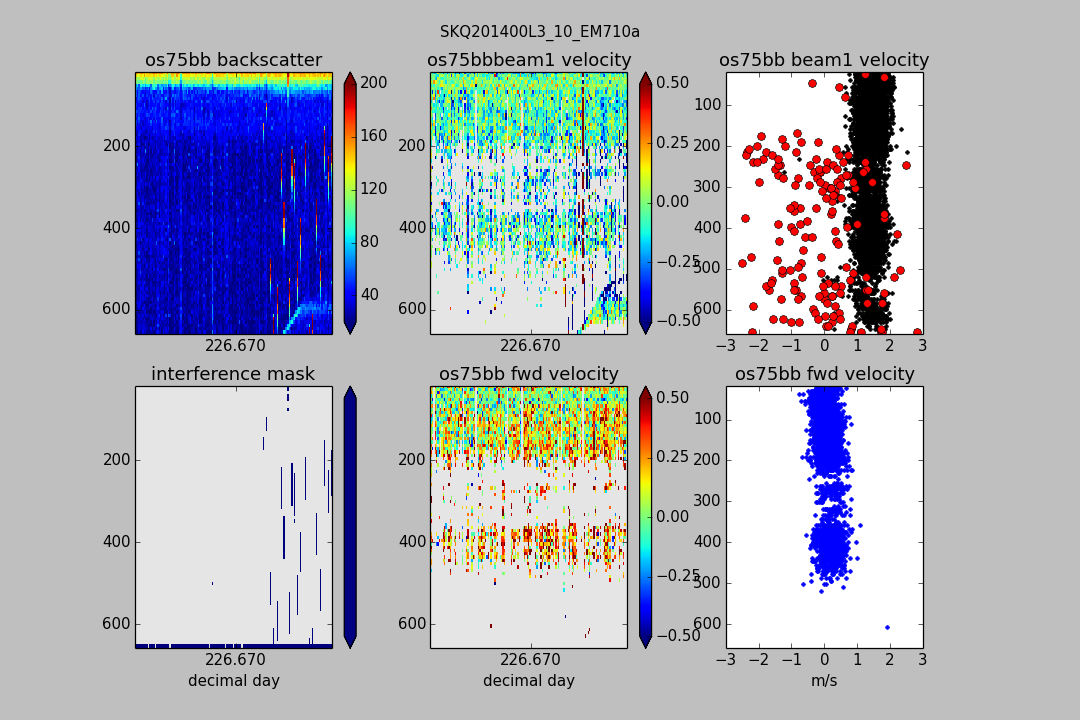
(above) EM710a interference on os75bb
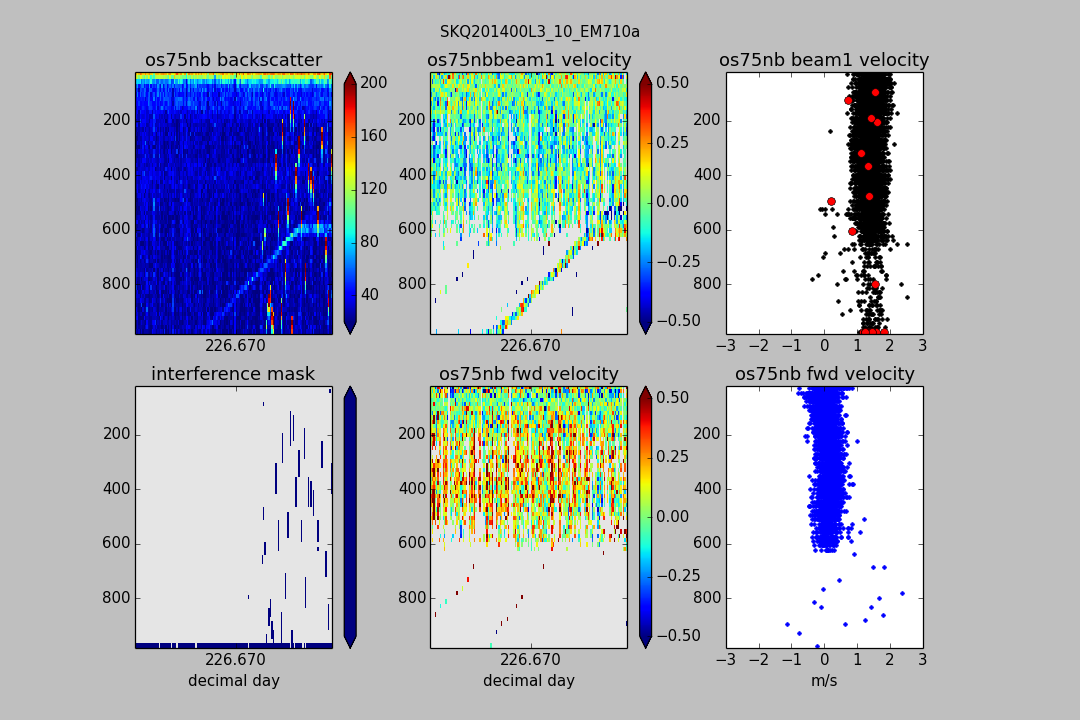
(above) EM710a interference on os75nb
Triggering (K-Sync)
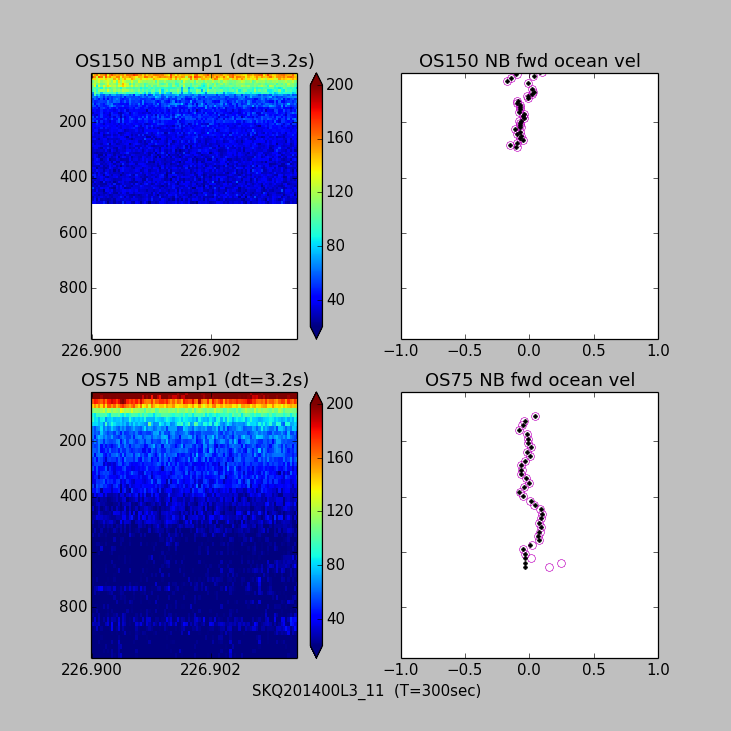
(above) ksync : lots of pings, but pulse kills os75 top 100m
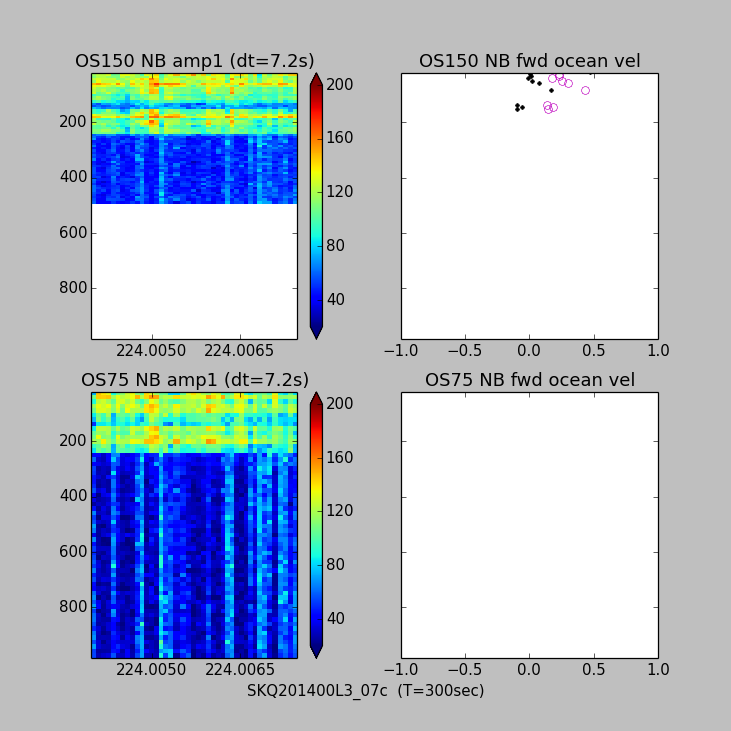
(above) ksync : very few pings, but pulse kills os75 top 250m
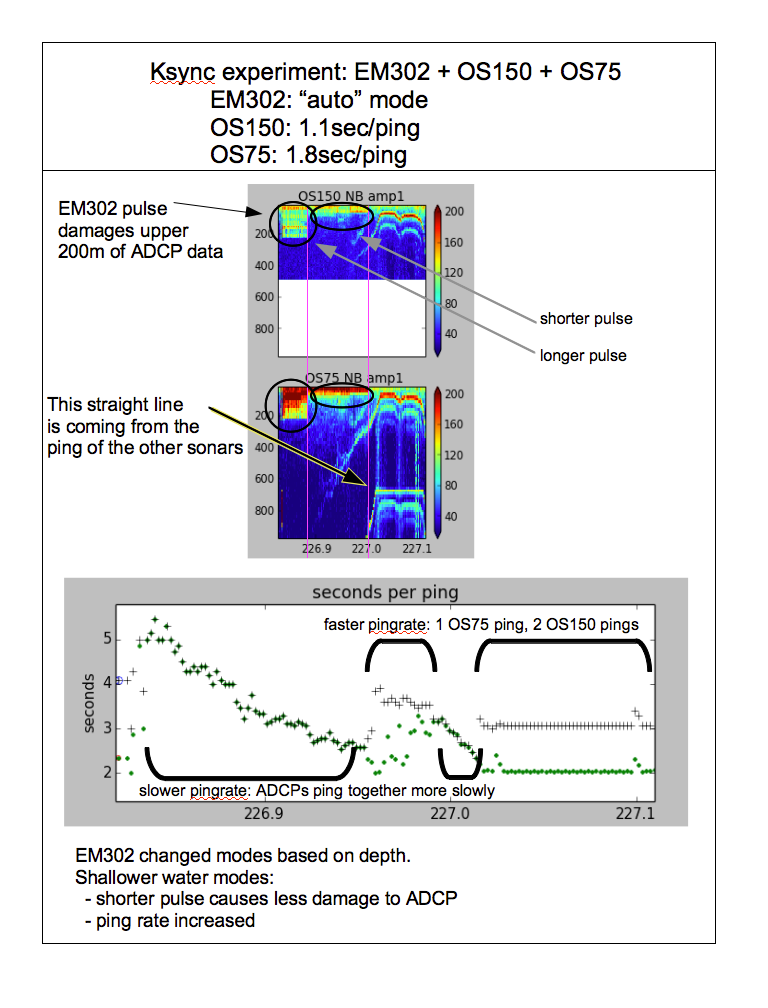
(above) timing changes during EM302-driven KSync with ADCPs