Atlantic Explorer GPS report
Julia Hummon
UHDAS Team
Dec 2019
The BIOS ship Atlantic Explorer runs UHDAS for ADCP data acquisition. UHDAS requires position for ADCP processing and records GPS positions from 3 GPS sources. One is specified as "primary" and is used for the ADCP processing. The rest are monitored for health.
All sources are serial (no UDP, for instance). Every GPGGA message gets a timestamp from the UHDAS computer. On all ships, we try to have the computer using an NTP time server. On Atlantic Explorer we are using a timeserver and it is working.
There are several types of plots we can make with the time data from one instrument. It is easiest if these are plotted in seconds:
difference in time between UHDAS computer clock and GPGGA timestamps:
If the computer is using an NTP server, and that NTP server is working, we would expect that this number would be around zero, but pretty constant, i.e. the computer time is very close to the GGA time.
This would be true even if there are gaps in the data (due to 'stop recording').
If the computer time is not synced to an ntp server, then it would have a slow drift compared to the GPGGA messages
sequential difference in UHDAS computer timestamps (time span between messages):
The sequential differences should be quite constant, but there might be isolated large gaps (eg. acquisition was halted for a period of time).
If there are gaps of a few seconds and compensating smaller gaps, then there could be a buffering problem: all the messages are coming in but some are late, so others arrive as a cluster. We can't know from the computer time whether any messages were actually lost.
If the number is negative, then the computer clock went backward.
sequential differences in the GGA timestamps (time span between messages):
During a period of continuous data recording,
- there should not be any gaps
- the time between messages should be absolutely constant
If there are gaps not related to stop-start recording, then GPS lines are getting lost. That could be due to
- missing at the source
- bad checksum (so the message is not written)
If the number is negative, then the GPS is broken in some way
If the time between messages is not constant, this indicates a problem with the GPS timing -- one example is shown below.
All of the following figures have 3 rows, with the rows sharing the same time axis.
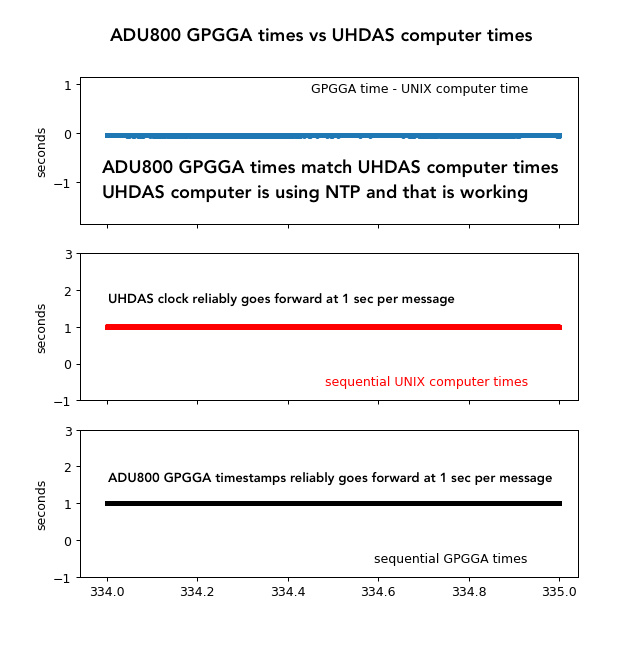
ADU800 timestamps for 1 day
This is what we hope to see in all cases:
- time difference between computer timestamp and associated GGA message is zero
- computer timestamps are coming in regularly 1-second apart
- GPGGA timestamps are coming in regularly 1-second apart
This plot gives us confidence in the UHDAS computer timestamps, the ADU800 GPS timestamps, and NTP.
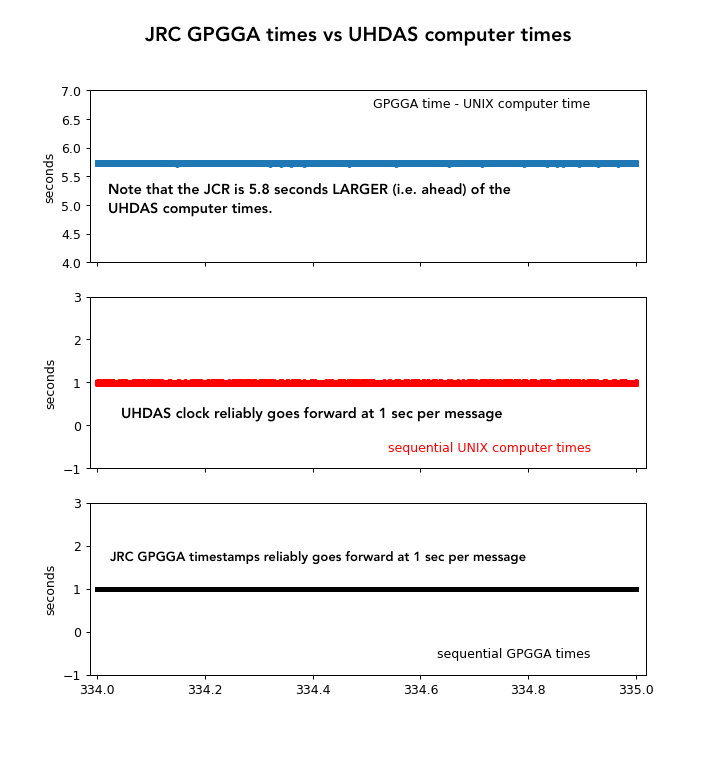
JRC timestamps for 1 day
This looks good except for the JRC timestamps, which are 5.8 seconds in the future compared to the UHDAS computer time:
- time difference between computer timestamp and associated GGA message is NOT zero
- computer timestamps are coming in regularly 1-second apart (good)
- GPGGA timestamps are coming in regularly 1-second apart (good)
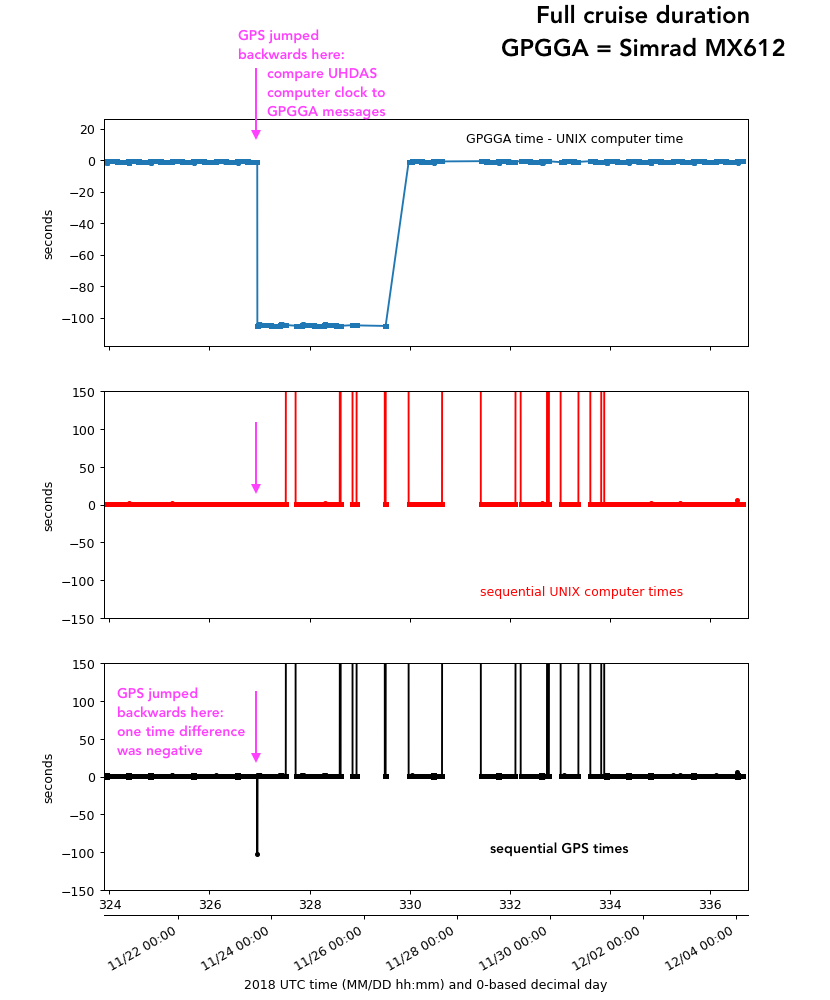
GPS timestamps for the Simrad MX612; all days
In panel 1 we see the GPGGA timestamps going backwards, then forward. Panels 2 and 3 will be shown later, with more detail.
We can tell when it went backward, but UHDAS was not logging data when it went forward.
$GPGGA,225459.0,2630.6255,N,07223.3258,W,2,10,0.8,6.5,M,-44.0,M,5.0,0138*4D
$GPGGA,225500.0,2630.6258,N,07223.3256,W,2,10,0.8,5.0,M,-44.0,M,6.0,0138*46
$GPGGA,225501.0,2630.6265,N,07223.3256,W,2,10,0.8,4.4,M,-44.0,M,7.0,0138*4D
$GPGGA,225502.0,2630.6274,N,07223.3260,W,2,10,0.8,5.3,M,-44.0,M,7.0,0138*4D
$GPGGA,225503.0,2630.6282,N,07223.3264,W,2,10,0.8,6.9,M,-44.0,M,7.0,0138*48
$GPGGA,225504.0,2630.6287,N,07223.3264,W,2,10,0.8,7.6,M,-44.0,M,4.0,0138*47
$GPGGA,225505.0,2630.6289,N,07223.3262,W,2,10,0.8,7.9,M,-44.0,M,5.0,0138*40
$GPGGA,225506.0,2630.6292,N,07223.3263,W,2,10,0.8,7.8,M,-44.0,M,6.0,0138*4A  ## 11/23  22:55:07
$GPGGA,225323.0,2630.6298,N,07223.3265,W,2,10,0.8,7.0,M,-44.0,M,7.0,0138*4E  ## jumped back
$GPGGA,225324.0,2630.6306,N,07223.3266,W,2,10,0.8,6.0,M,-44.0,M,7.0,0138*4D
$GPGGA,225325.0,2630.6313,N,07223.3267,W,2,10,0.8,5.4,M,-44.0,M,7.0,0138*4E
$GPGGA,225326.0,2630.6318,N,07223.3270,W,2,10,0.8,5.8,M,-44.0,M,4.0,0138*4F
$GPGGA,225327.0,2630.6324,N,07223.3273,W,2,10,0.8,6.8,M,-44.0,M,5.0,0138*40
$GPGGA,225328.0,2630.6331,N,07223.3275,W,2,10,0.8,7.4,M,-44.0,M,6.0,0138*43
$GPGGA,225329.0,2630.6340,N,07223.3278,W,2,10,0.8,7.5,M,-44.0,M,7.0,0138*49
$GPGGA,225330.0,2630.6350,N,07223.3281,W,2,10,0.8,7.1,M,-44.0,M,7.0,0138*42
$GPGGA,225331.0,2630.6355,N,07223.3281,W,2,10,0.8,6.3,M,-44.0,M,7.0,0138*45
$GPGGA,225332.0,2630.6355,N,07223.3281,W,2,10,0.8,6.0,M,-44.0,M,4.0,0138*46
$GPGGA,225333.0,2630.6356,N,07223.3283,W,2,10,0.8,6.6,M,-44.0,M,5.0,0138*41
$GPGGA,225334.0,2630.6363,N,07223.3286,W,2,10,0.8,7.1,M,-44.0,M,6.0,0138*40
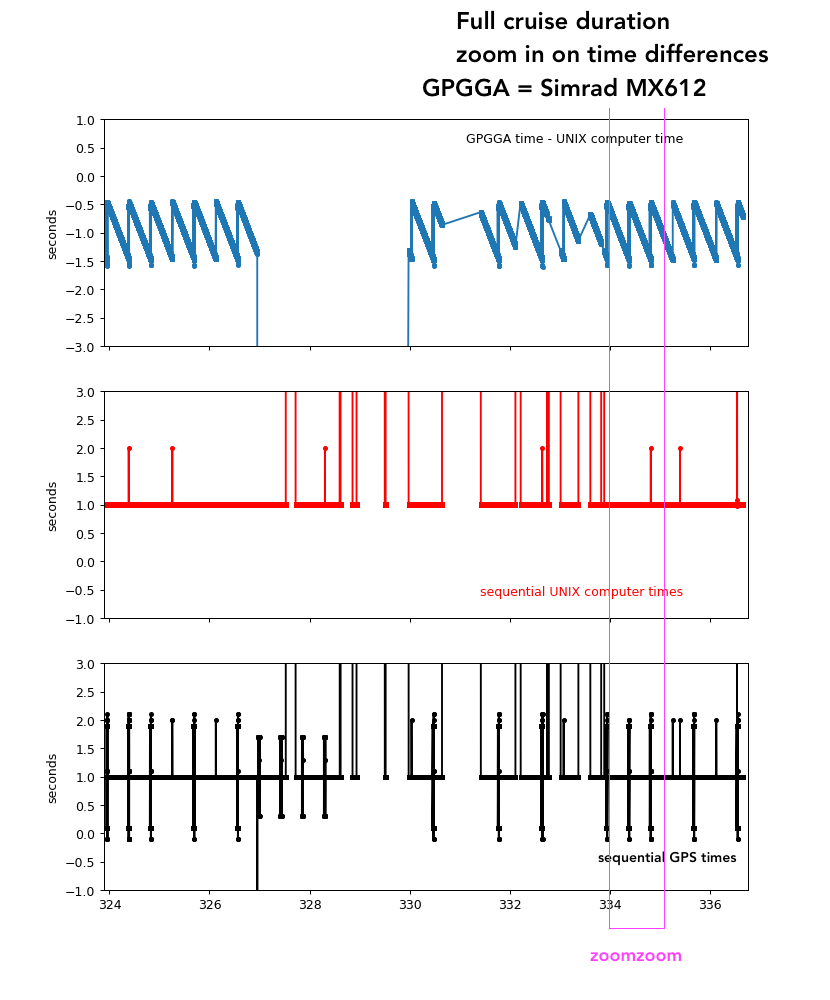
GPS timestamps for the Simrad MX612; all days
Zooming in on the y-axis to look at the time differences we see
panel 1:
We see a sawtooth pattern where the time between GPGGA and computer repeatedly drifted, then adjusted. Time error varies from 0.5 to 1.5 seconds difference.
panel 2:
There are large jumps when logging was stopped
panel 3:
About twice per day there is a period of adjustment of 0-2sec, including some negative adjustments.
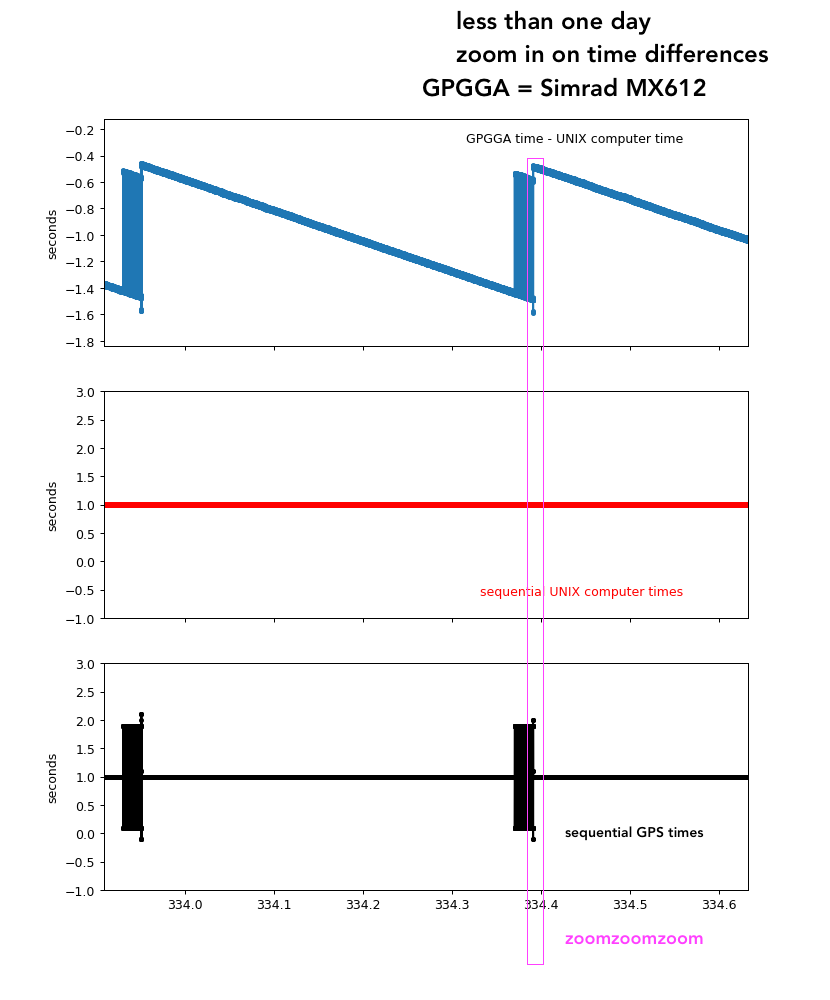
GPS timestamps for the Simrad MX612; 15 hours
This is a zoom in on the adjustment period of the previous plot
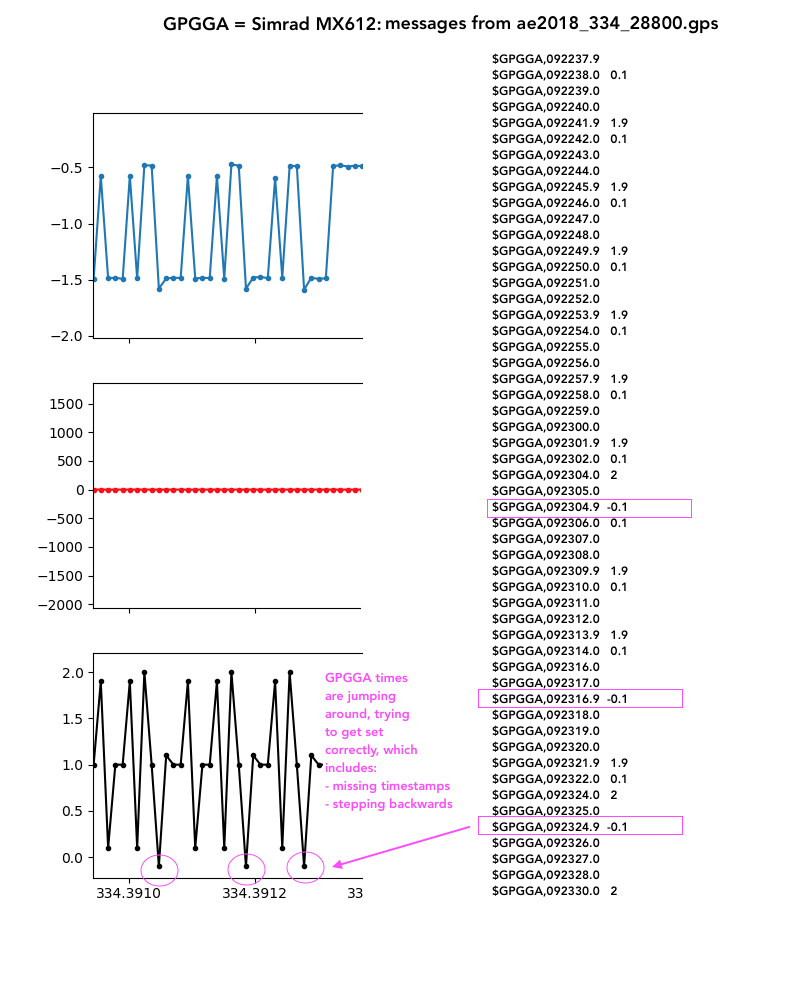
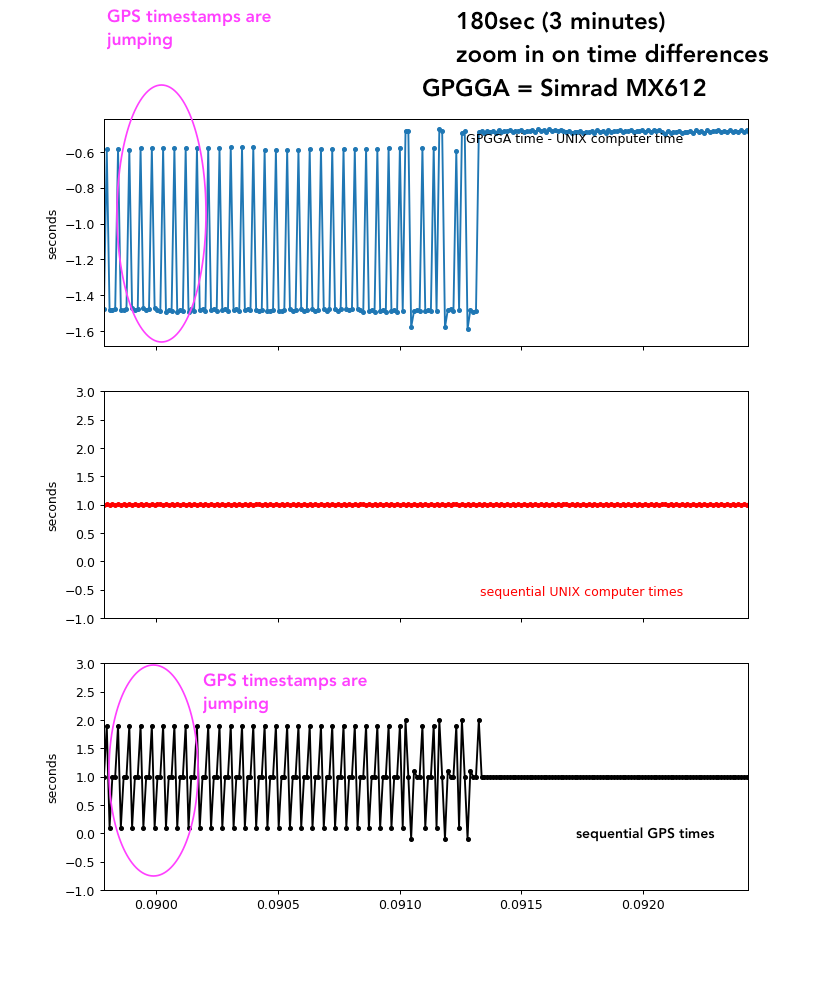
GPS timestamps for the Simrad MX612; 180 sec
This is a zoom in on the adjustment period of the previous plot
GPS timestamps for the Simrad MX612; tail end of the transition
This shows the actual $GPGGA messages (the timestamp part) and the messages corresponding to the jumps shown.