TN400 ADCP cruise report
Jules Hummon
April 8, 2022
- Thompson cruise TN400: San Diego to Honolulu, March 12-20, 2022.
- Purpose: troubleshoot the electrical noise in the os75.
Abstract:
When electrical interference was present in the computer lab with the long cable, it went away when we went down to the laundry room and used the short cable, and was still present when we logged data back up in the computer lab with the long cable. The electrical noise is getting in through the long cable.
The electrical noise is intermittent. The presence of electrical noise in the velocities was only obvious at slower-than-underway speeds, possibly because the range decreased just enough to hide it. The stability of the temperature signal correlated strongly with the presence (or absence) of noise in the velocities.
Note
Electrical noise is intermittent, but is getting in through the long RDI cable. Moving the deck unit and UPS to the laundry room to use the short cable removed the electrical noise.
Tests:
- Only the first test (laundry room) did not use a UPS. Electrical interference depended on the power source
All the rest did use UPS power
- second test (computer lab): No electrical interference was found regardless of outlet
- third test
- “part08” (computer lab): Electrical interference was found under many circumstances
- ”part11” (laundry): no electrical noise
- “part12” (computer lab): Electrical noise still present
Details of the testing are in the detailed PDF cruise report
Test1
Speed and power source testing in the laundry room with the short RDI cable. No UPS was used for these tests. Electrical interference was present on some of the power sources. Only one caused interference problems with broadband mode.
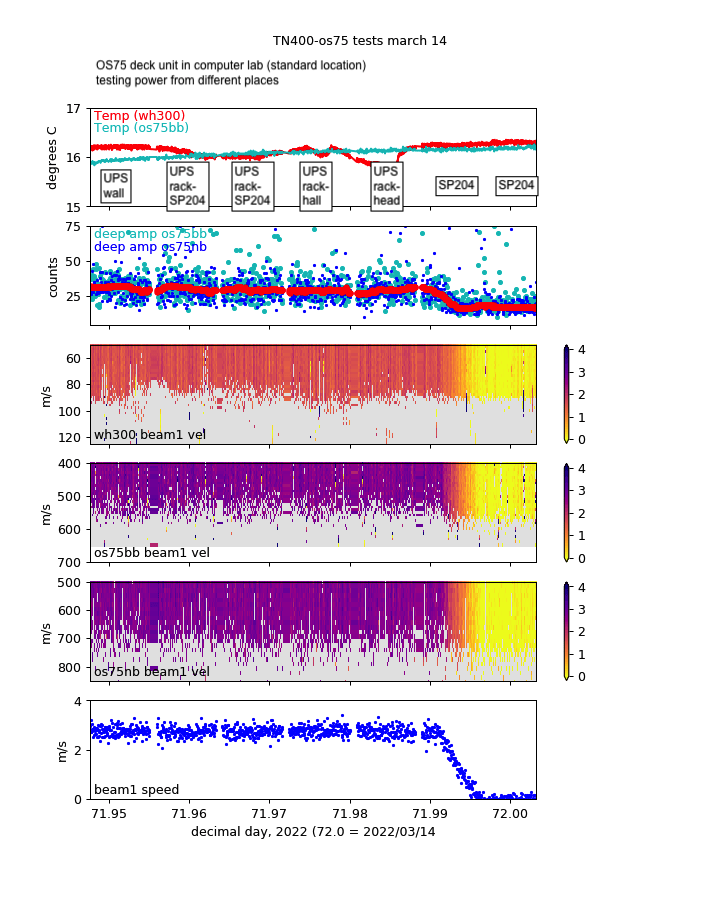
(full size: test1 beam 1 velocity and speed)
This figure has temperature of both wh300 and os75 in the top panel, and a deep signal return in the second panel. The next 3 panels are panel plots of beam 1 velocity from each of the instruments (wh300, os75 broadband mode, and os75 narrowband mode). The last panel is beam1 speed in a shallow (uncontaminated) reference layer. The horizontal axis is floating point day of year (UTC), in this case mostly March 13.

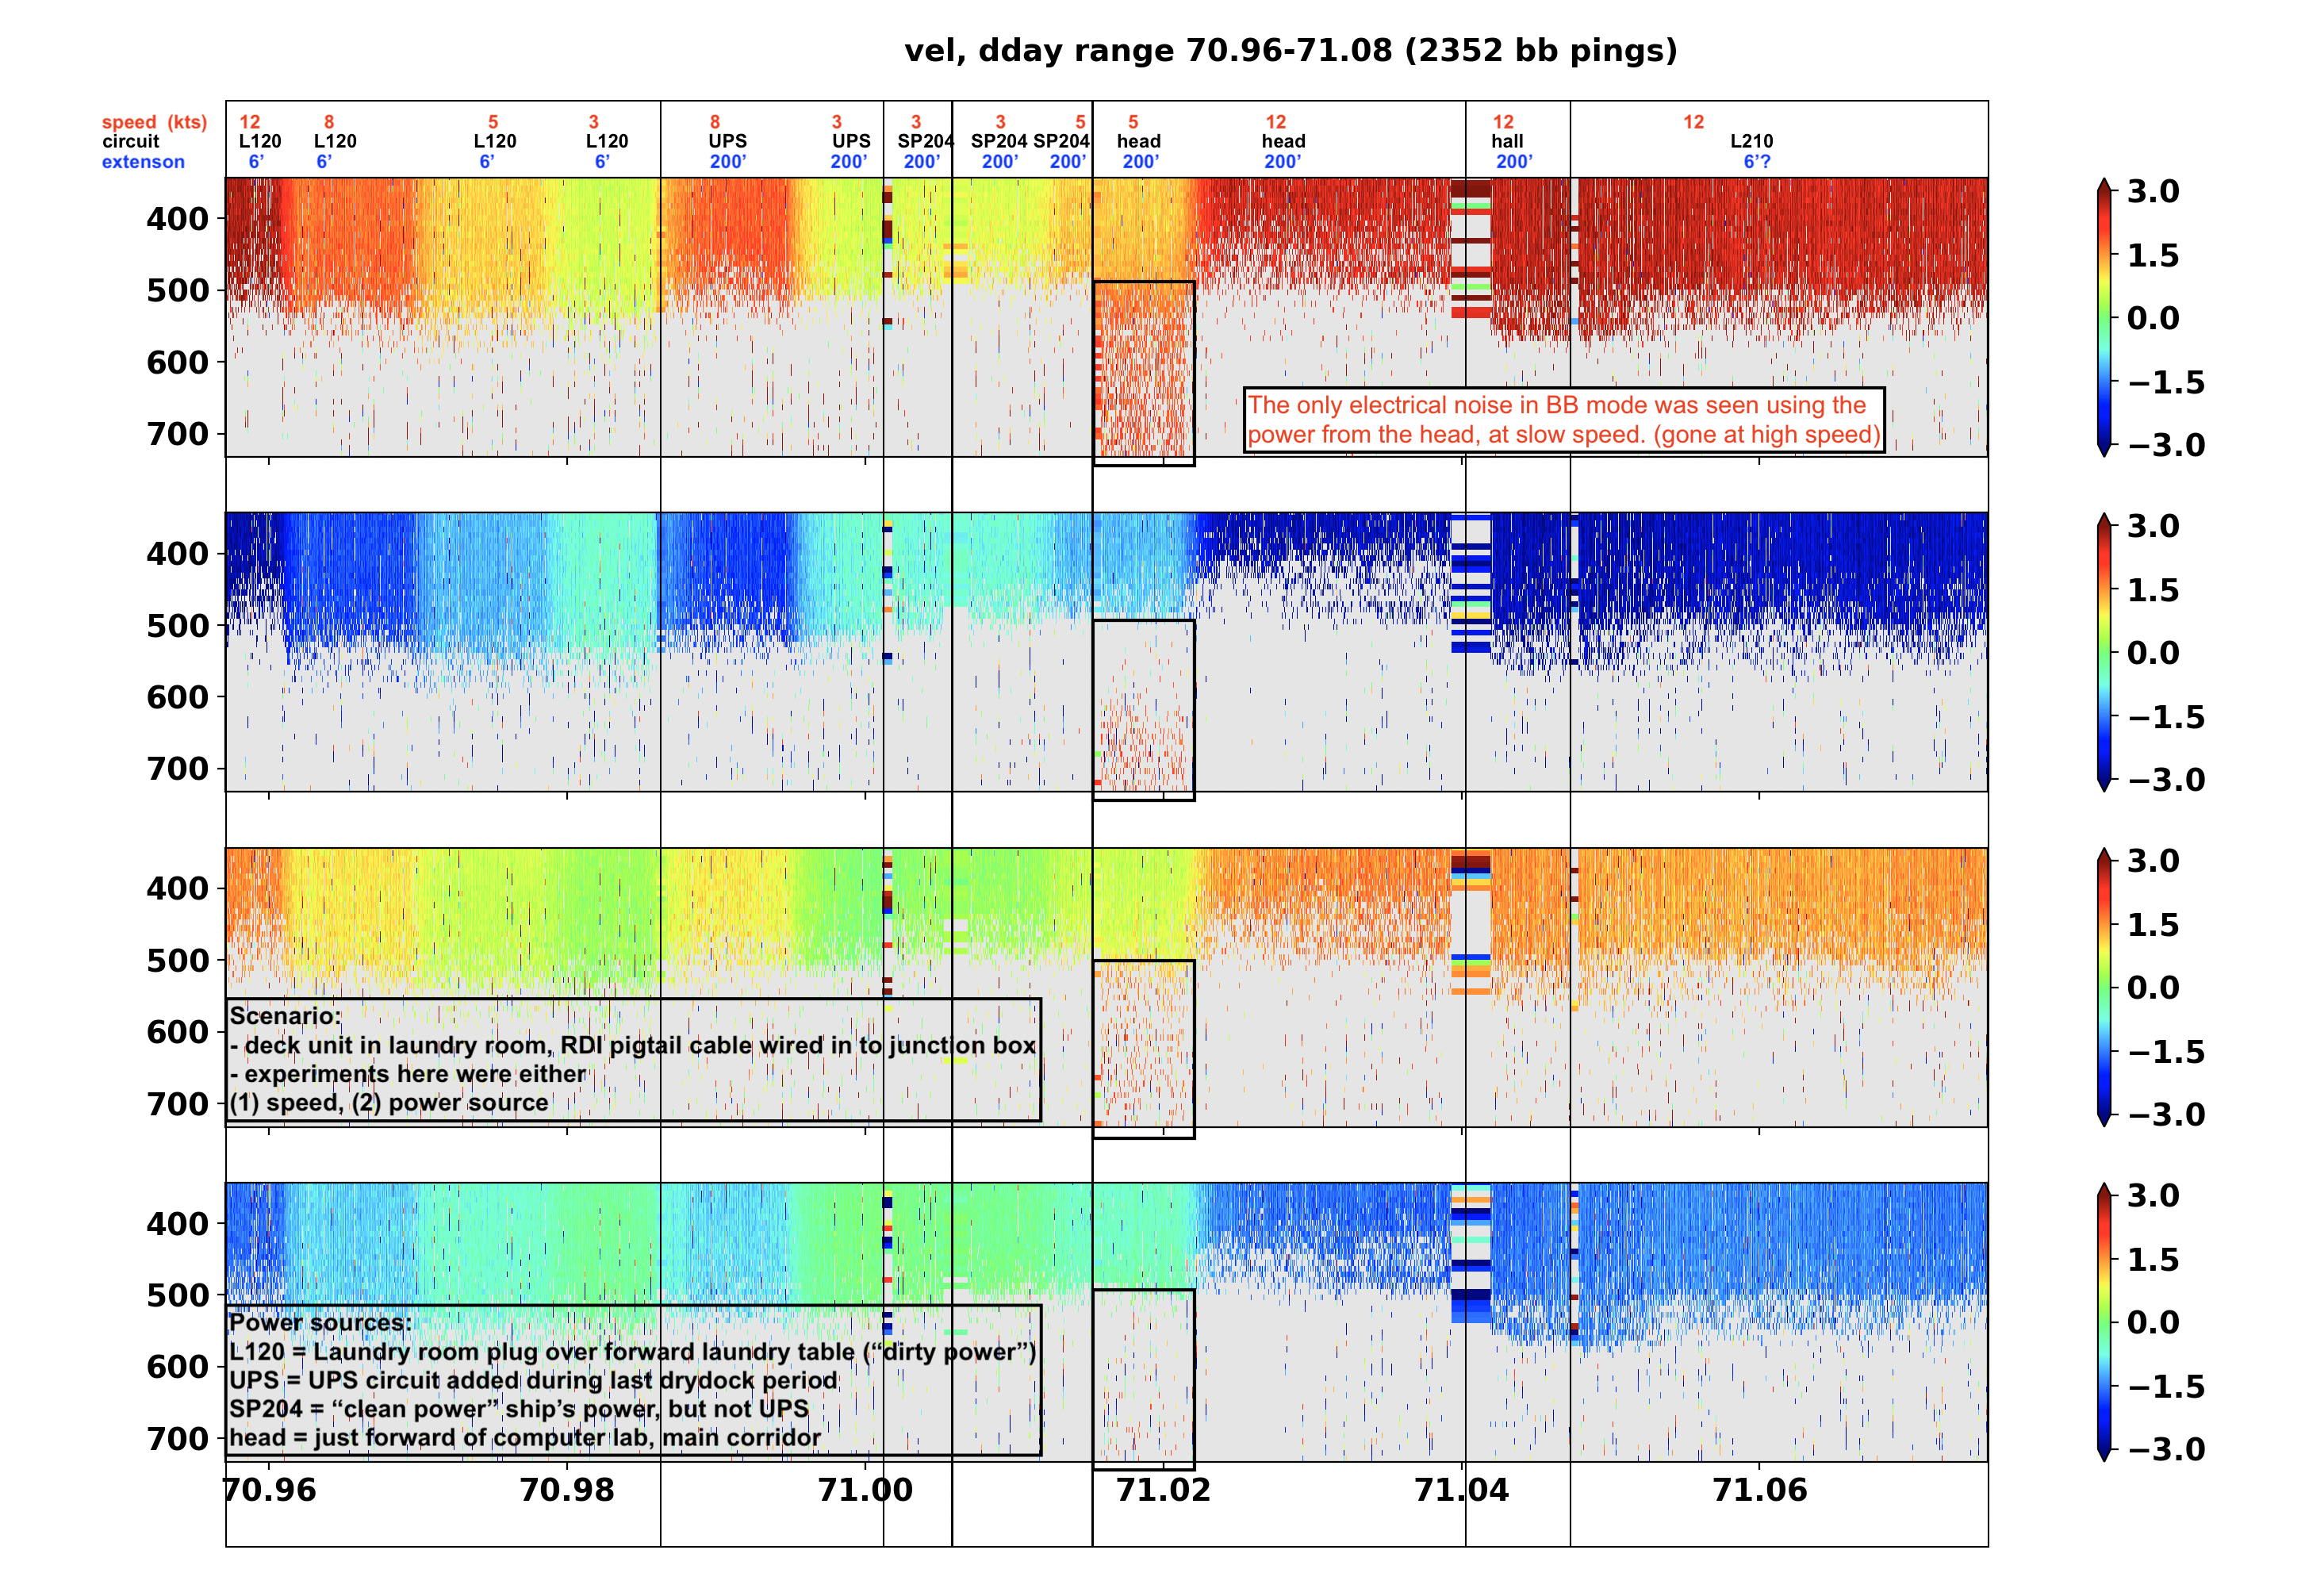
(full size: test 1, segment 1, beam velocities)
This figure shows panel plots of beam velocity for the OS75 broadband mode. The vertical axis is depth in meters, and the horizontal axis is floating point day of year (UTC), in this case mostly March 13.

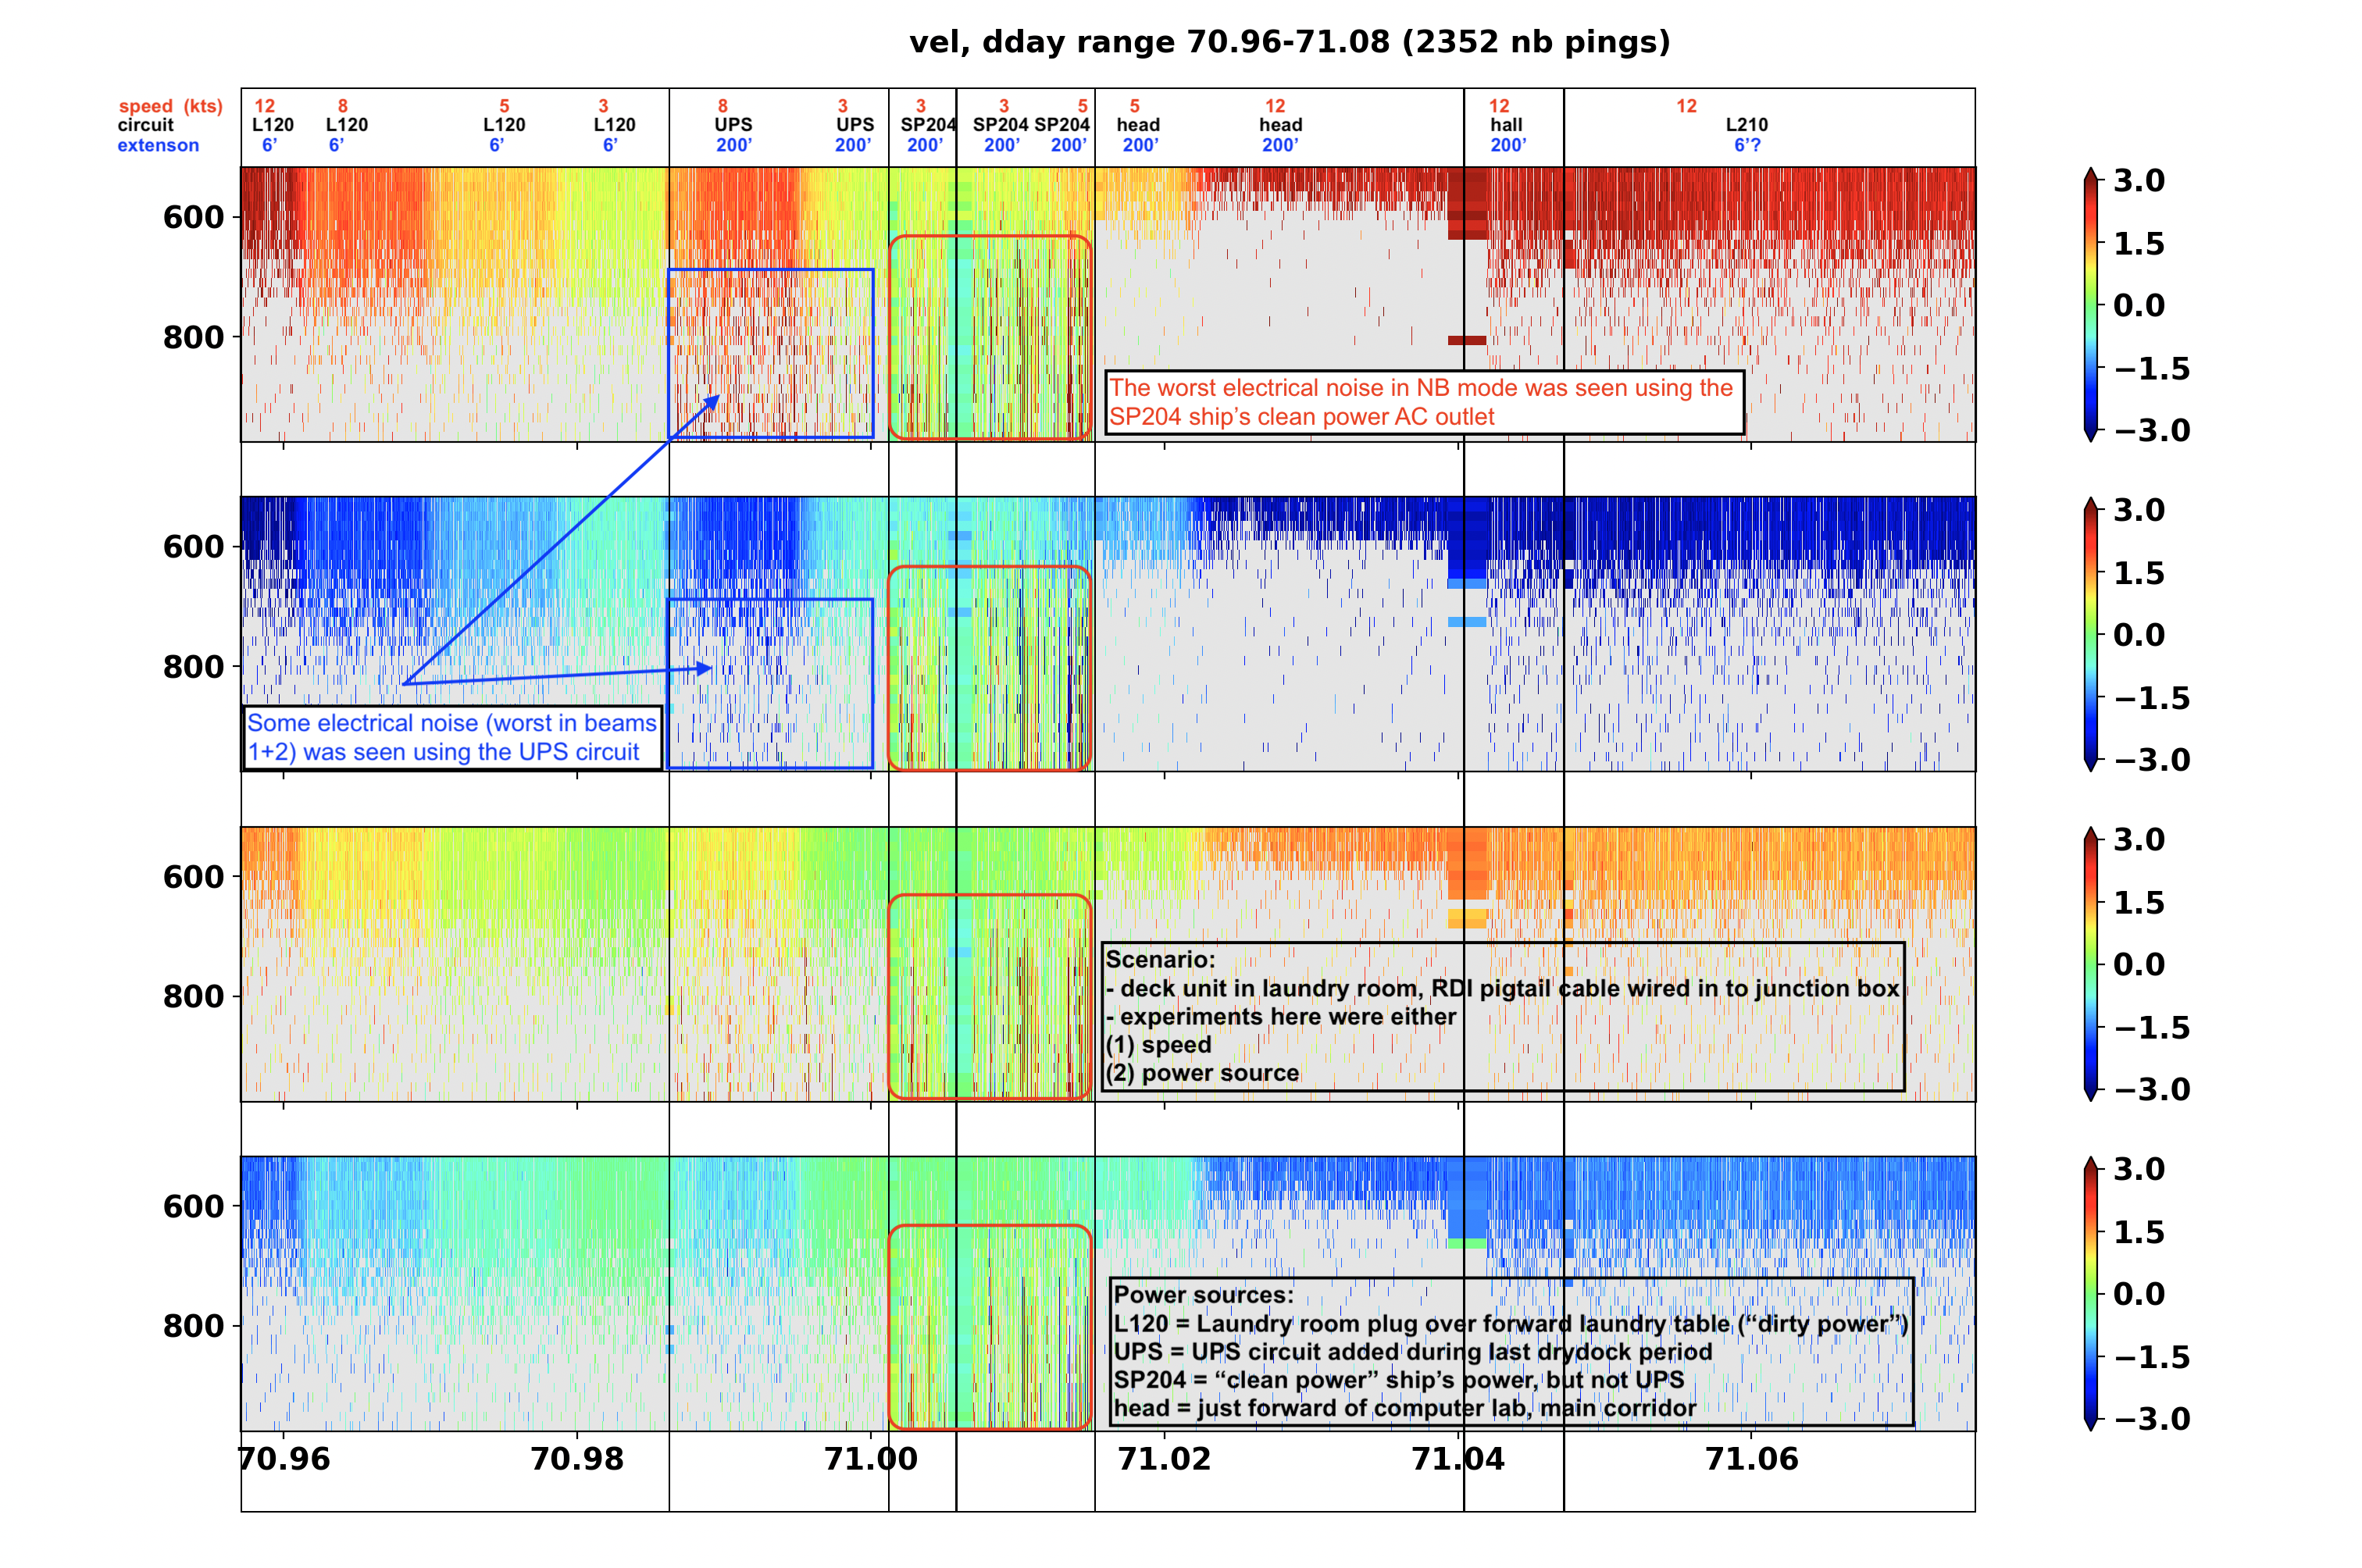
(full size: test 1, segment 2, beam velocities)
This figure shows panel plots of beam velocity for the OS75 narrowband mode. The vertical axis is depth in meters, and the horizontal axis is floating point day of year (UTC), in this case mostly March 13.
Test2
Two speed tests with different sources of power from UPS - the circuit (main UPS for the computer lab) and the old pre-shipyard rack-mounted UPS, powered from different power sources (plugs). No interference was detected.

(full size: test 2 segment 1, beam1 velocities)
This figure has temperature of both wh300 and os75 in the top panel, and a deep signal return in the second panel. The next 3 panels are panel plots of beam 1 velocity from each of the instruments (wh300, os75 broadband mode, and os75 narrowband mode). The last panel is beam1 speed in a shallow (uncontaminated) reference layer. The horizontal axis is floating point day of year (UTC), in this case mostly March 14.
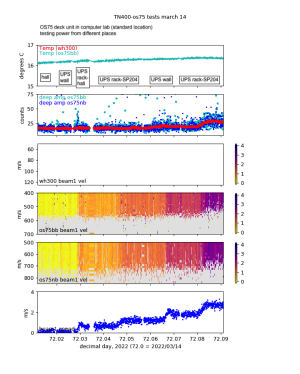
(full size: test 2 segment 2, beam1 velocities)
This figure has temperature of both wh300 and os75 in the top panel, and a deep signal return in the second panel. The next 3 panels are panel plots of beam 1 velocity from each of the instruments (wh300, os75 broadband mode, and os75 narrowband mode). The last panel is beam1 speed in a shallow (uncontaminated) reference layer. The horizontal axis is floating point day of year (UTC), in this case mostly March 14.
Test3
Discovery
Test 3 was precipitated by a serendipitous slowdown of the ship to change which engine was being used for the autopilot. Electrical interference was detected when the ship slowed down.

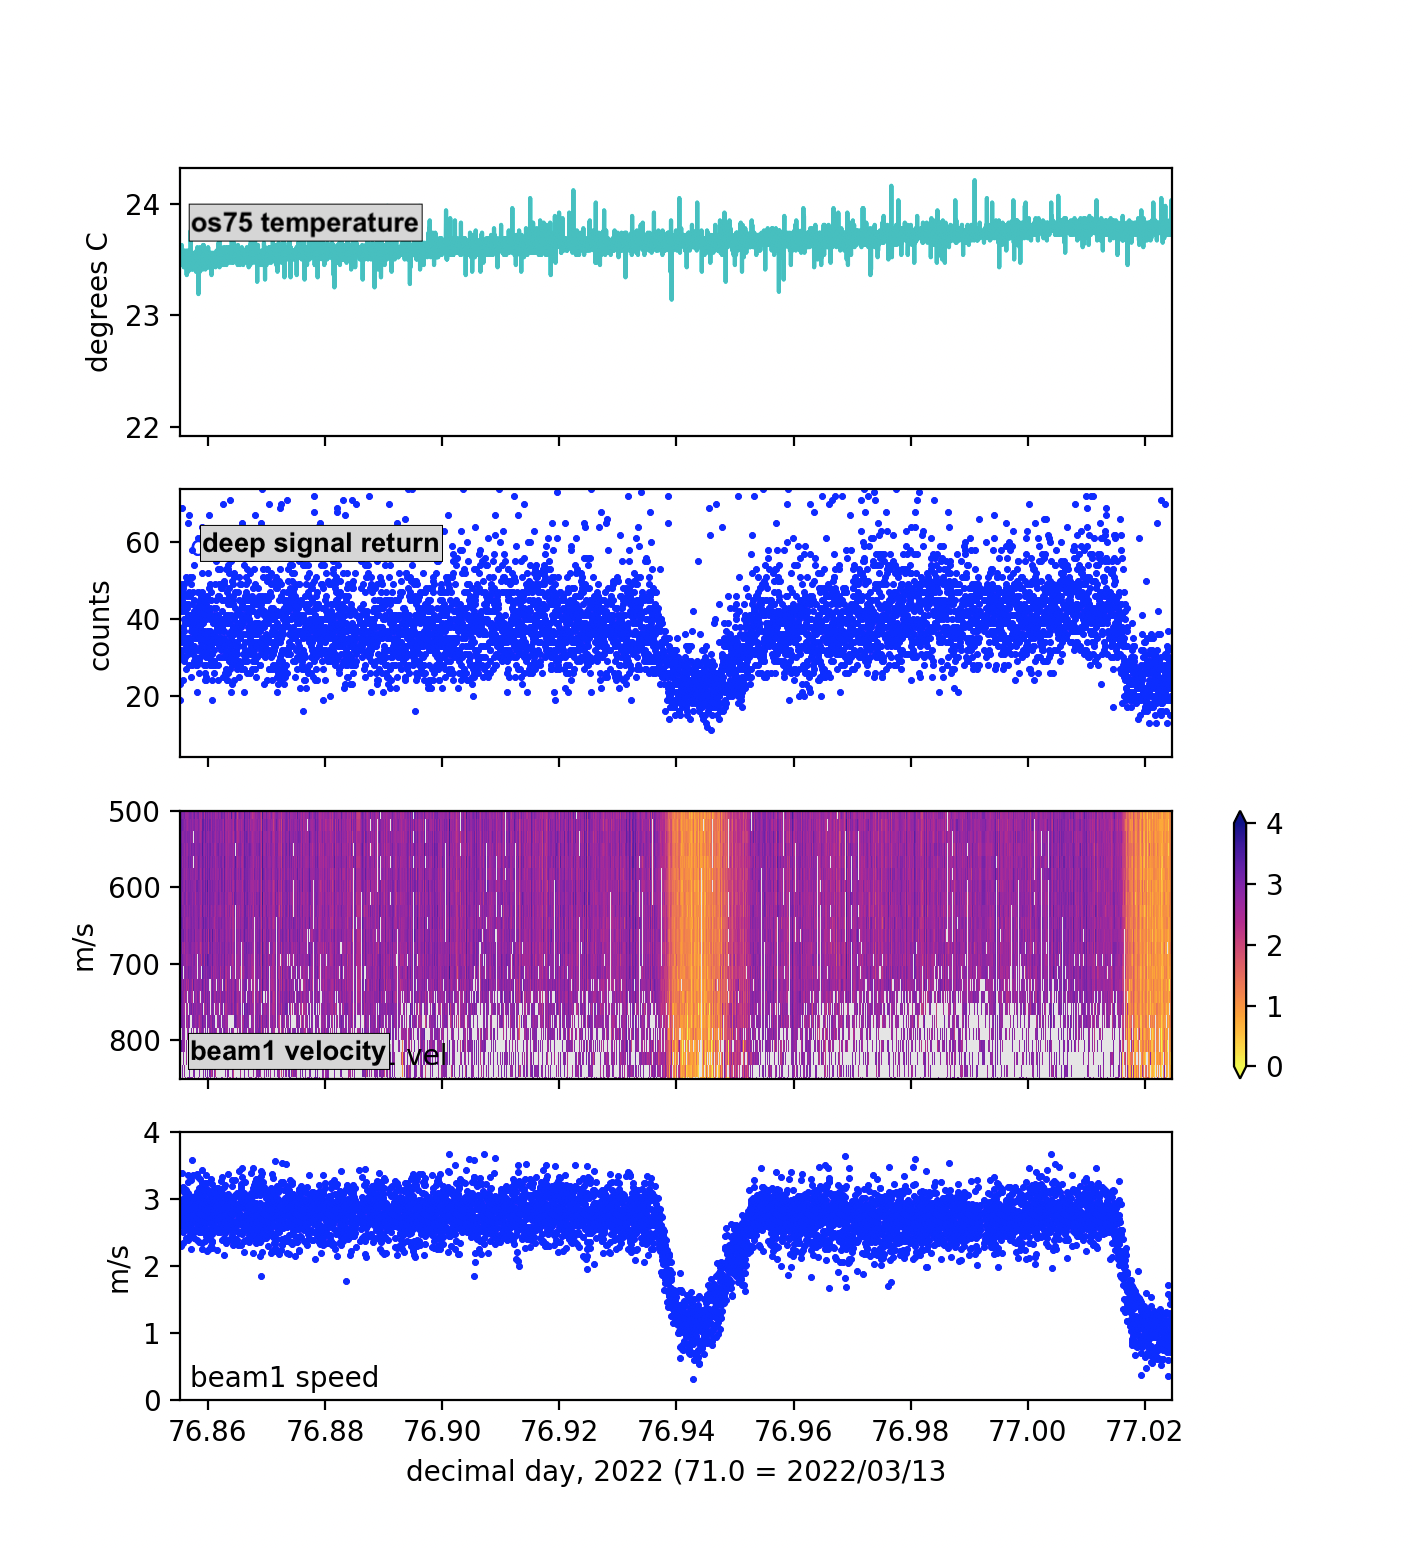
This figure has temperature of os75 in the top panel, and a deep signal return in the second panel. The next panel is beam 1 velocity from the os75 narrowband mode. The last panel is beam1 speed in a shallow (uncontaminated) reference layer. The horizontal axis is floating point day of year (UTC), in this case mostly March 18.
Since the electrical interference was apparently back, we immediately started testing. This time, we started with the usual long RDI cable and the deck unit in the rack. We worked out a plan with the engine room to test the two engines engines in autopilot and to try different power sources. The electrical noise was persistent.
(full size: "part08" discovery of interference)
(full size: "part08" discovery: beam velocities and processed data )
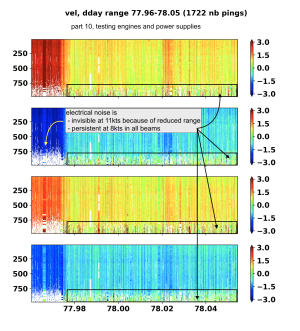
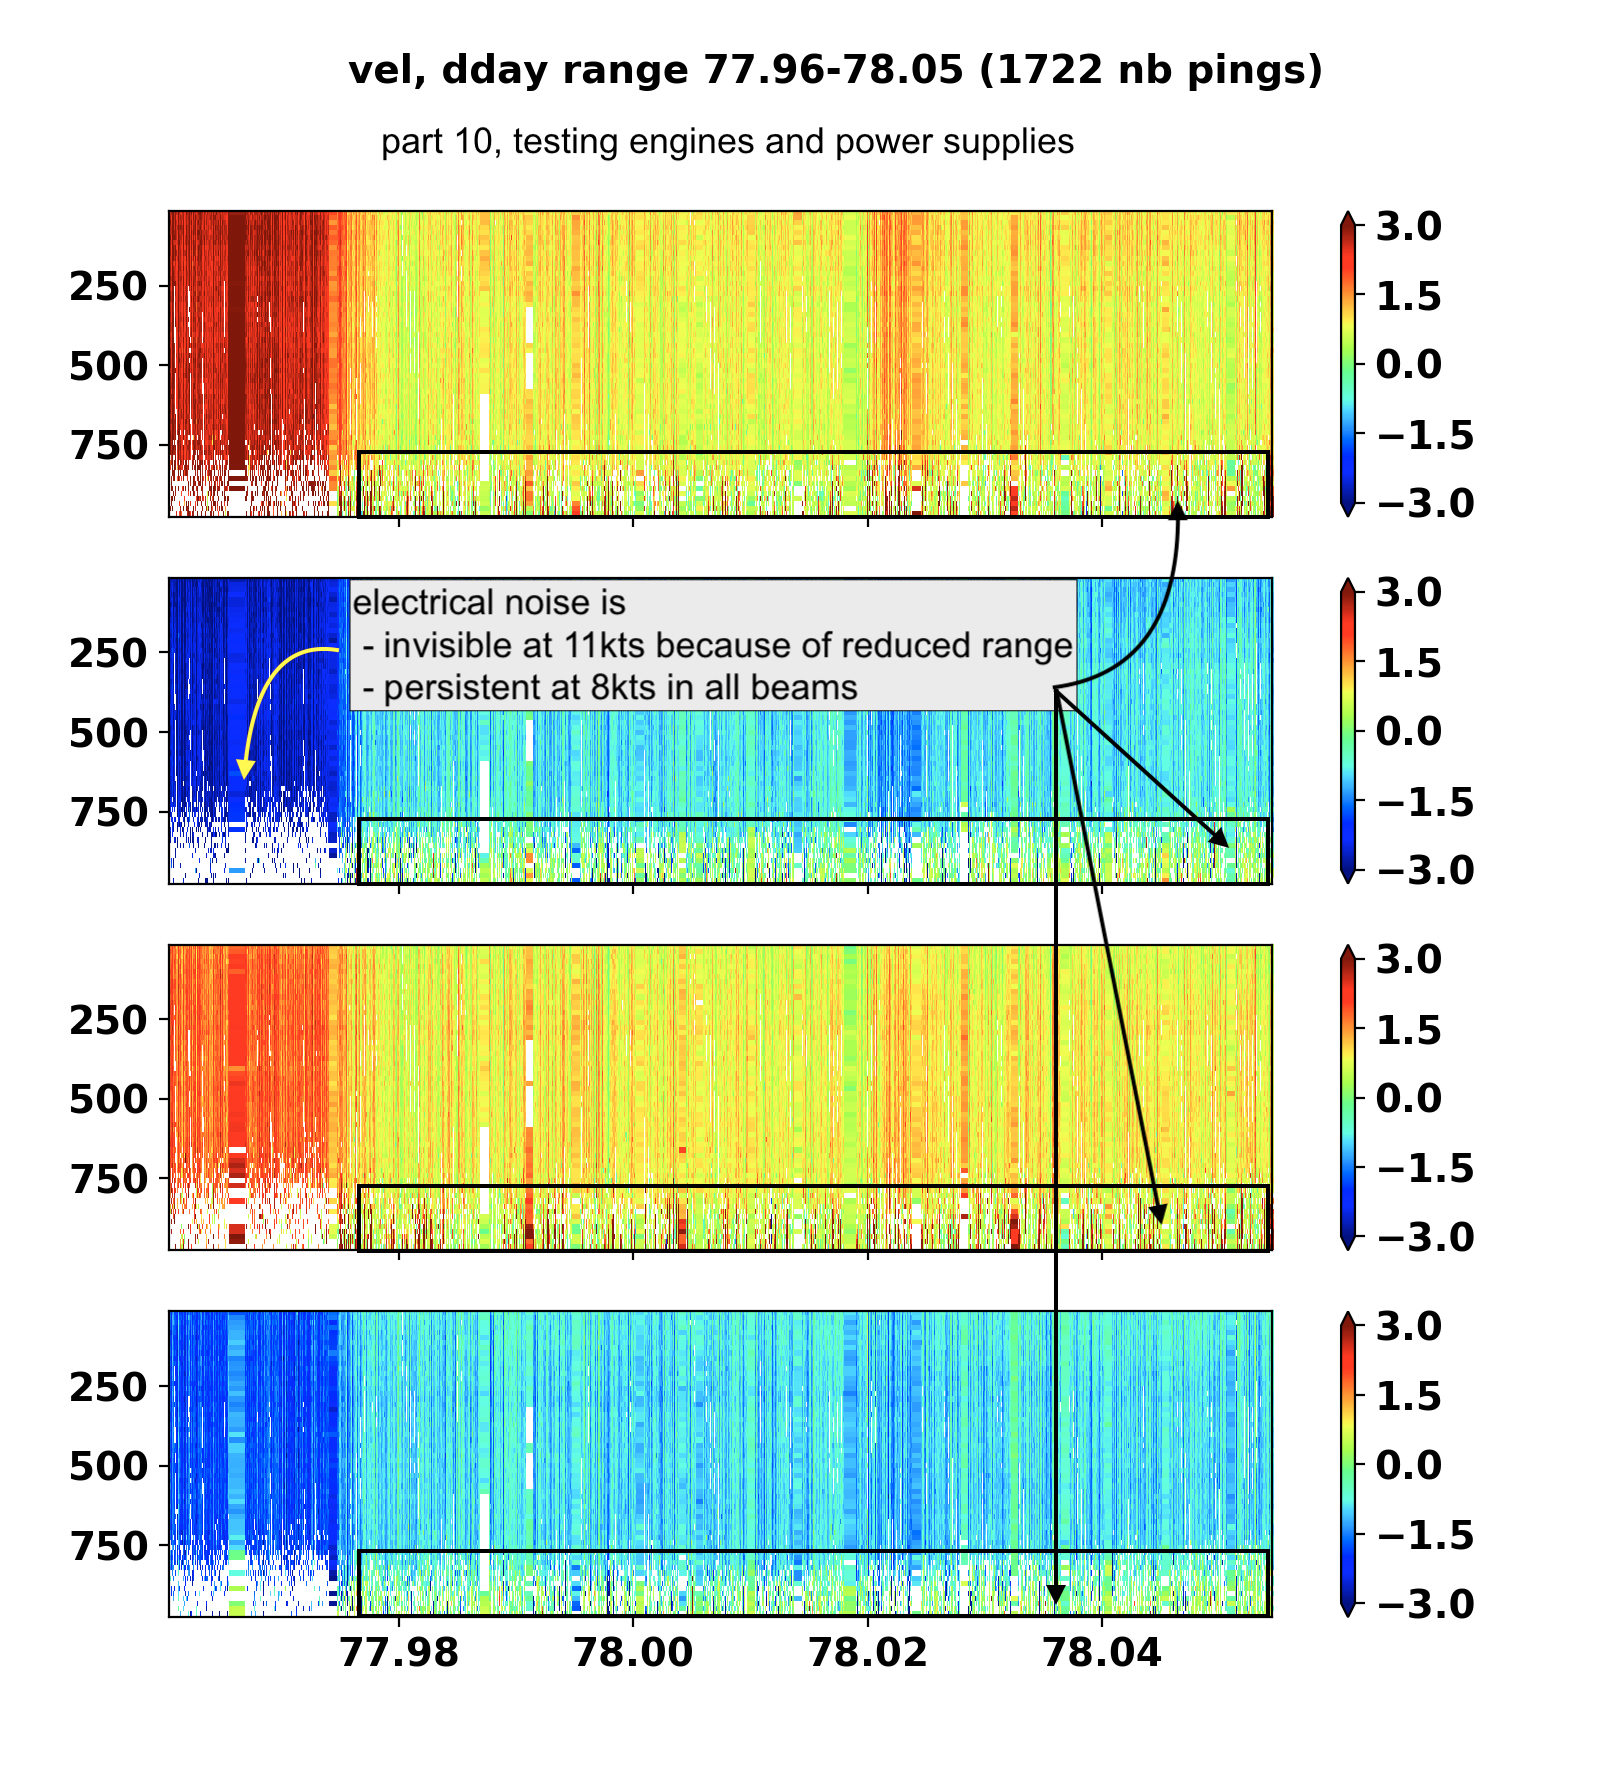
(A) Engine and Power Tests
We tested the use of autopilot on either port and starboard engine, and tested a variety of power sources (main lab UPS, rack-mounted UPS on clean power or dirty power) and the electrical noise was persistent. These tests uwed the long RDI cable, with the deck unit and the power all in the computer lab. The interference is identifiable because (1) it occurs below the range that the instrument should normally acquire good data, about 700m in this case, and (2) it is strongly biased. The bias is most obvious when the ship is sailing at 5-8kts.
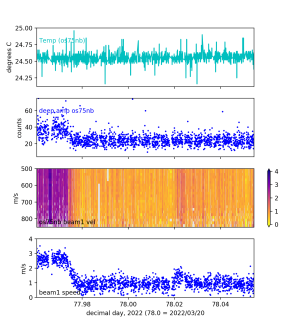
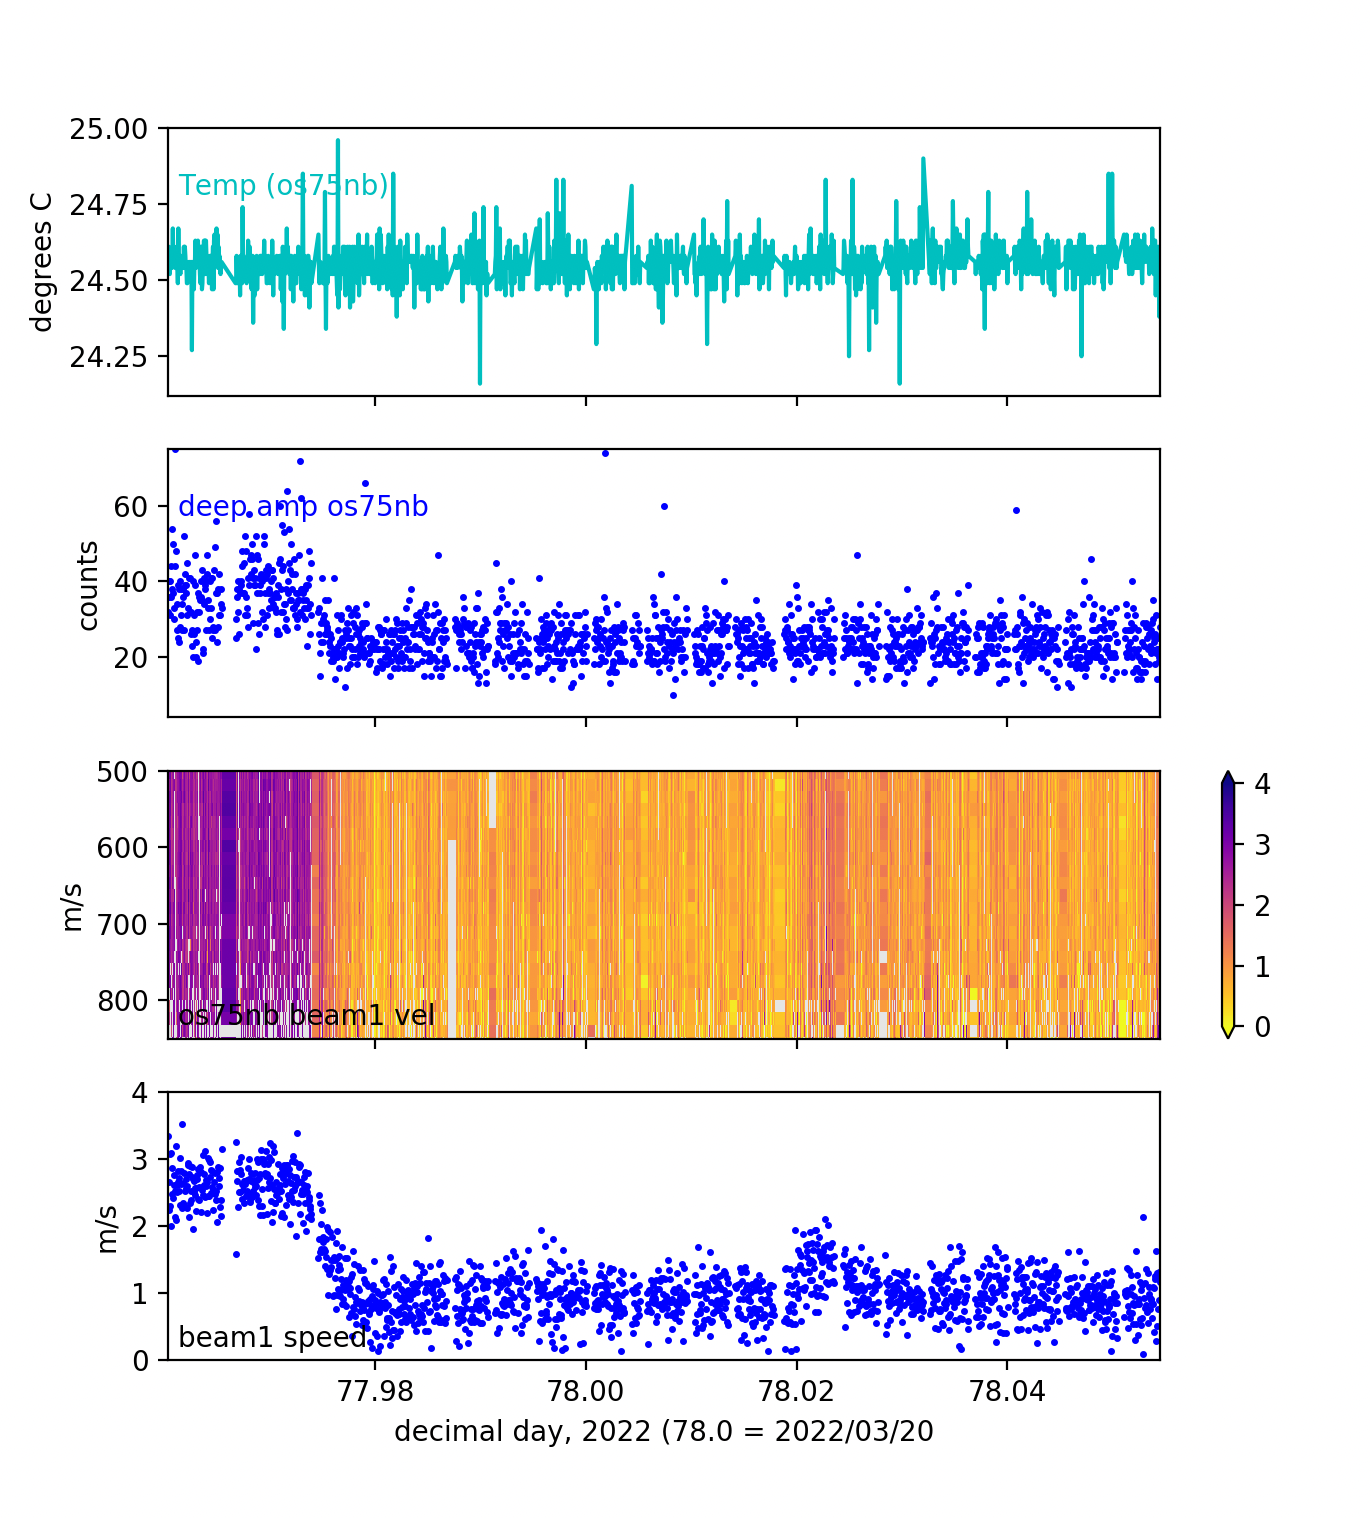
(full size: "part10" test 3A - beam1 velocity)
This figure has temperature of os75 in the top panel, and a deep signal return in the second panel. The next panel is beam 1 velocity from the os75 narrowband mode. The last panel is beam1 speed in a shallow (uncontaminated) reference layer. The horizontal axis is floating point day of year (UTC), in this case mostly March 20.
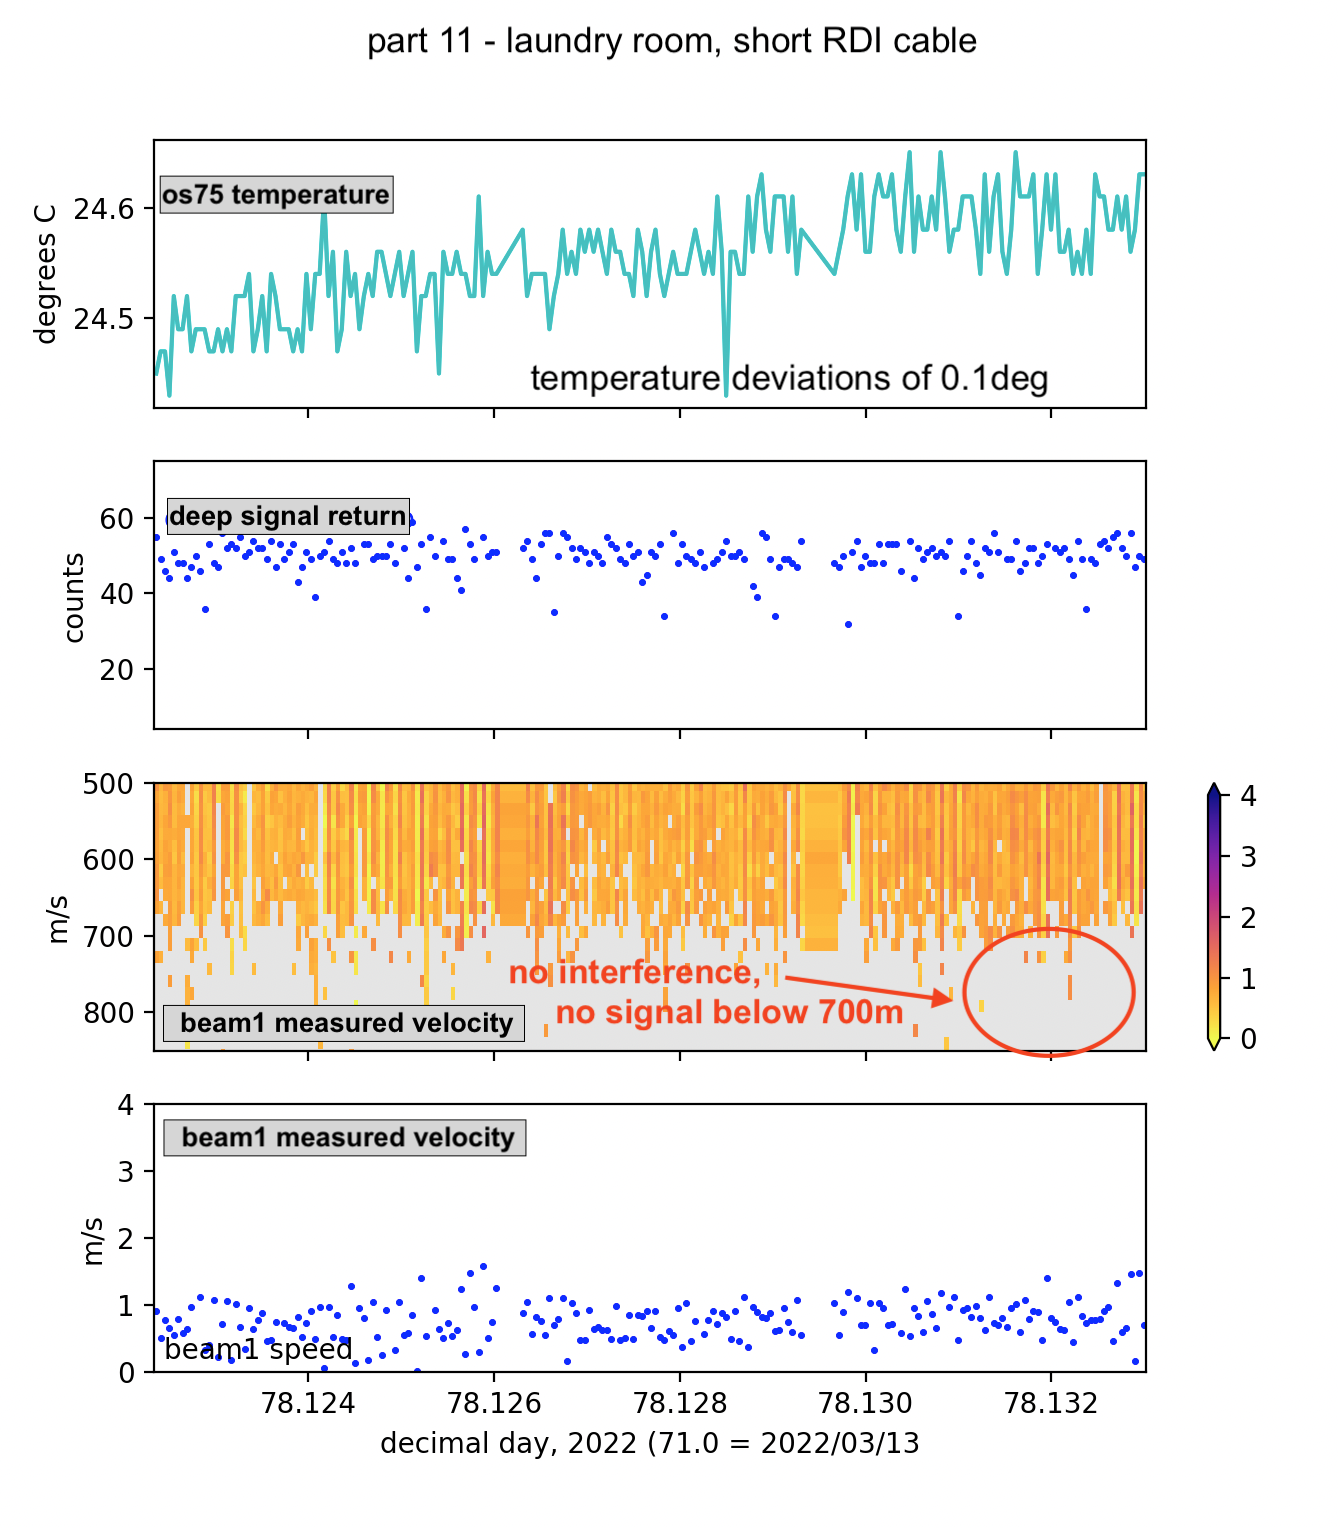
(B) Laundry room, short RDI cable, UPS
With the short RDI cable and the Rack-mounted UPS, we collected data in the laundry room. This data collection showed no signs of the electrical interference.
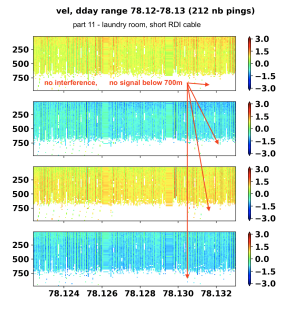
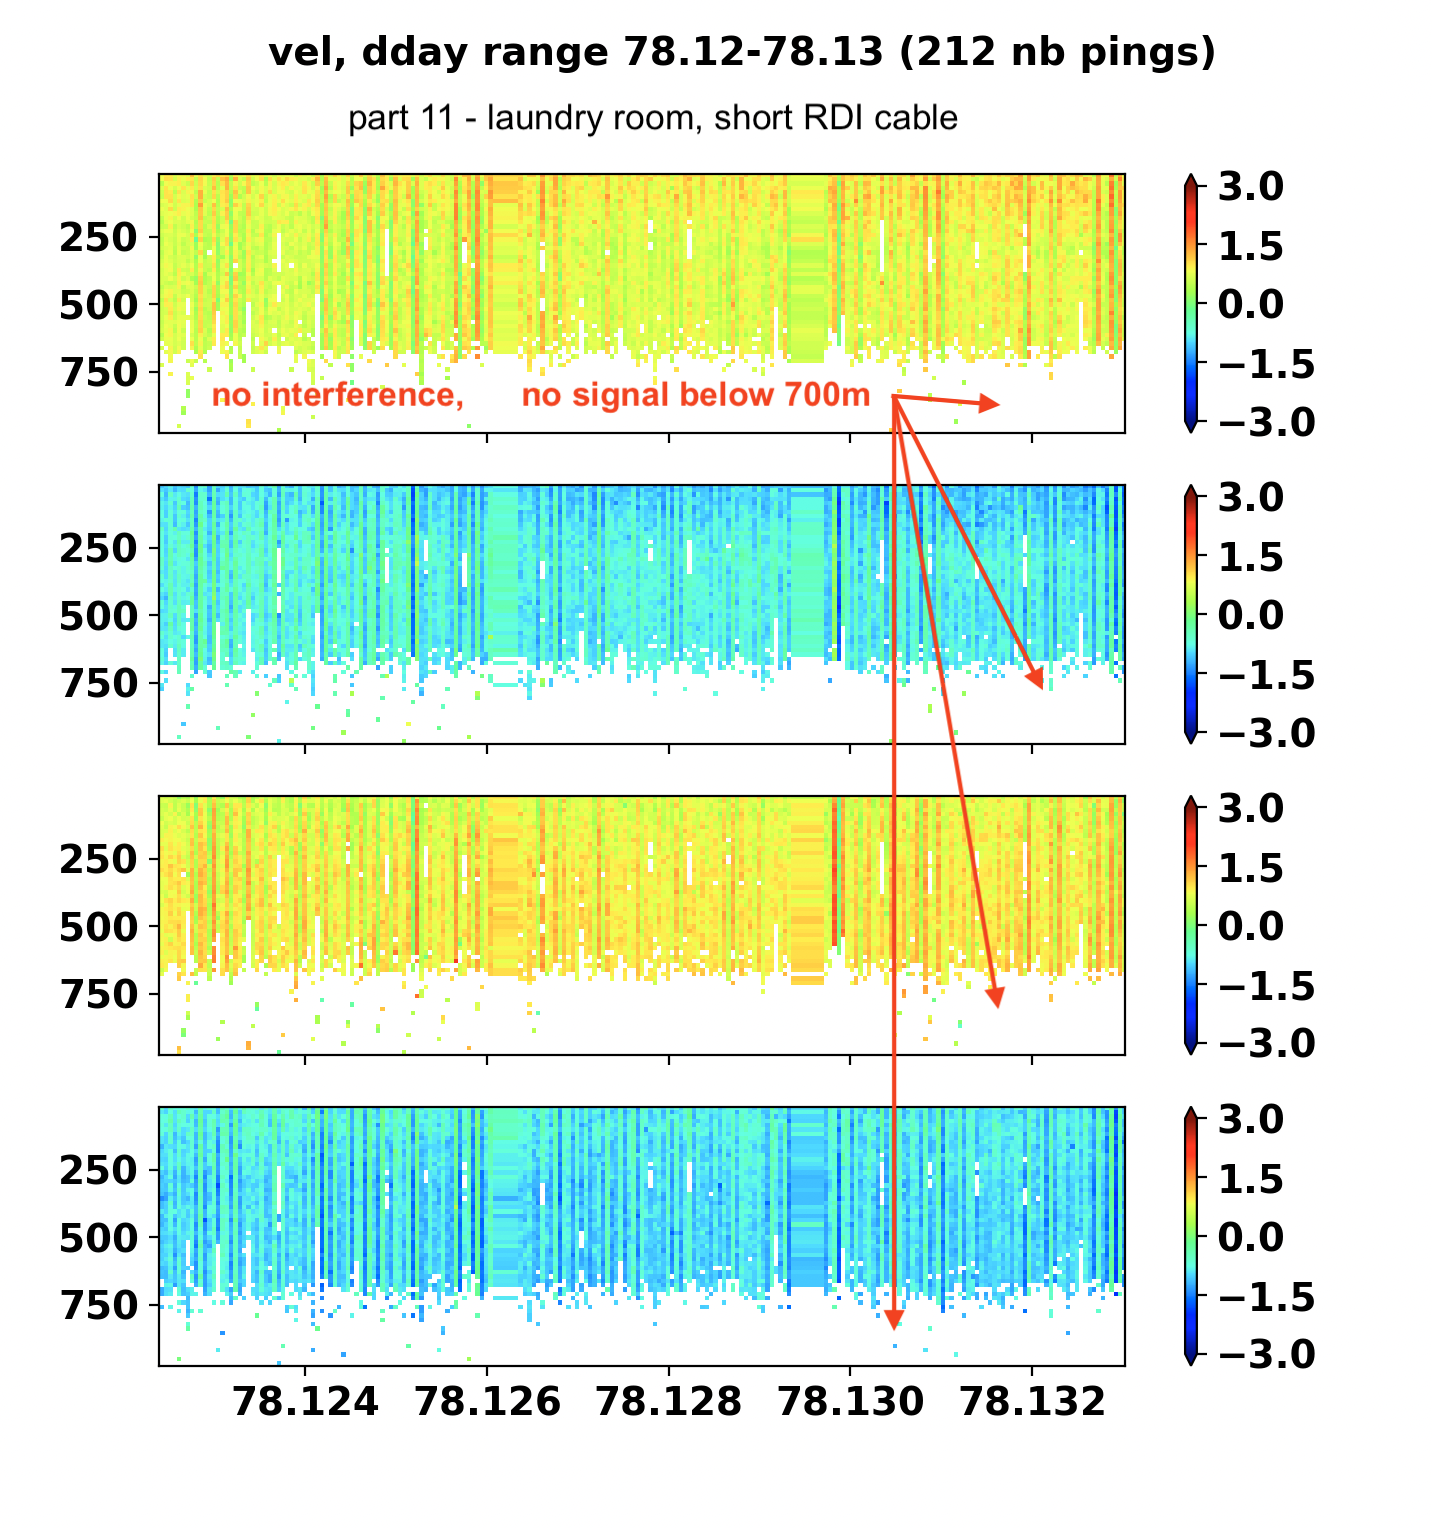
(full size: "part11" test 3B - 4 beams, no interference)
This figure shows panel plots of beam velocity for the OS75 narrowband mode. The vertical axis is depth in meters, and the horizontal axis is floating point day of year (UTC), in this case mostly March 13.
The range is about 700m and there is no sign of any signal deeper than 700m, therefore no sign of electrical interference.
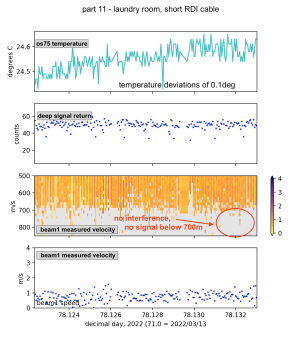
(full size: "part11" test 3B - beam 1, no interference)
This figure has temperature of os75 in the top panel, and a deep signal return in the second panel. The next panel is beam 1 velocity from the os75 narrowband mode. The last panel is beam1 speed in a shallow (uncontaminated) reference layer. The horizontal axis is floating point day of year (UTC), in this case March 20.
The range is about 700m and there is no sign of any signal deeper than 700m, therefore no sign of electrical interference.
(C) Computer lab, UPS, long RDI cable
Collecting data again with the long cable revealed the interference was still present.
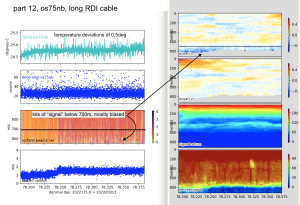
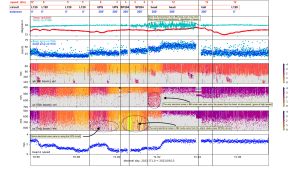
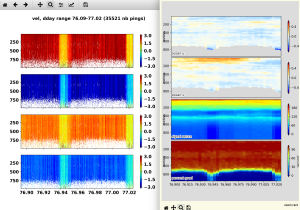
(full size): "part12" test 3C - beam 1, and processed
On the left of this figure we have temperature of os75 in the top panel, and a deep signal return in the second panel. The next panel is beam 1 velocity from the os75 narrowband mode. The last panel is beam1 speed in a shallow (uncontaminated) reference layer. The horizontal axis is floating point day of year (UTC), in this case mostly March 20.
The processed velocities are on the right, with E/W ocean velocity in the top panel and N/S velocities in the second paanel. Backscatter is in the third panel, and Percent Good is in the last panel. The horizontal axis is floating point day of year (UTC), in this case mostly March 20.
Extra Bonus: Temperature Stability
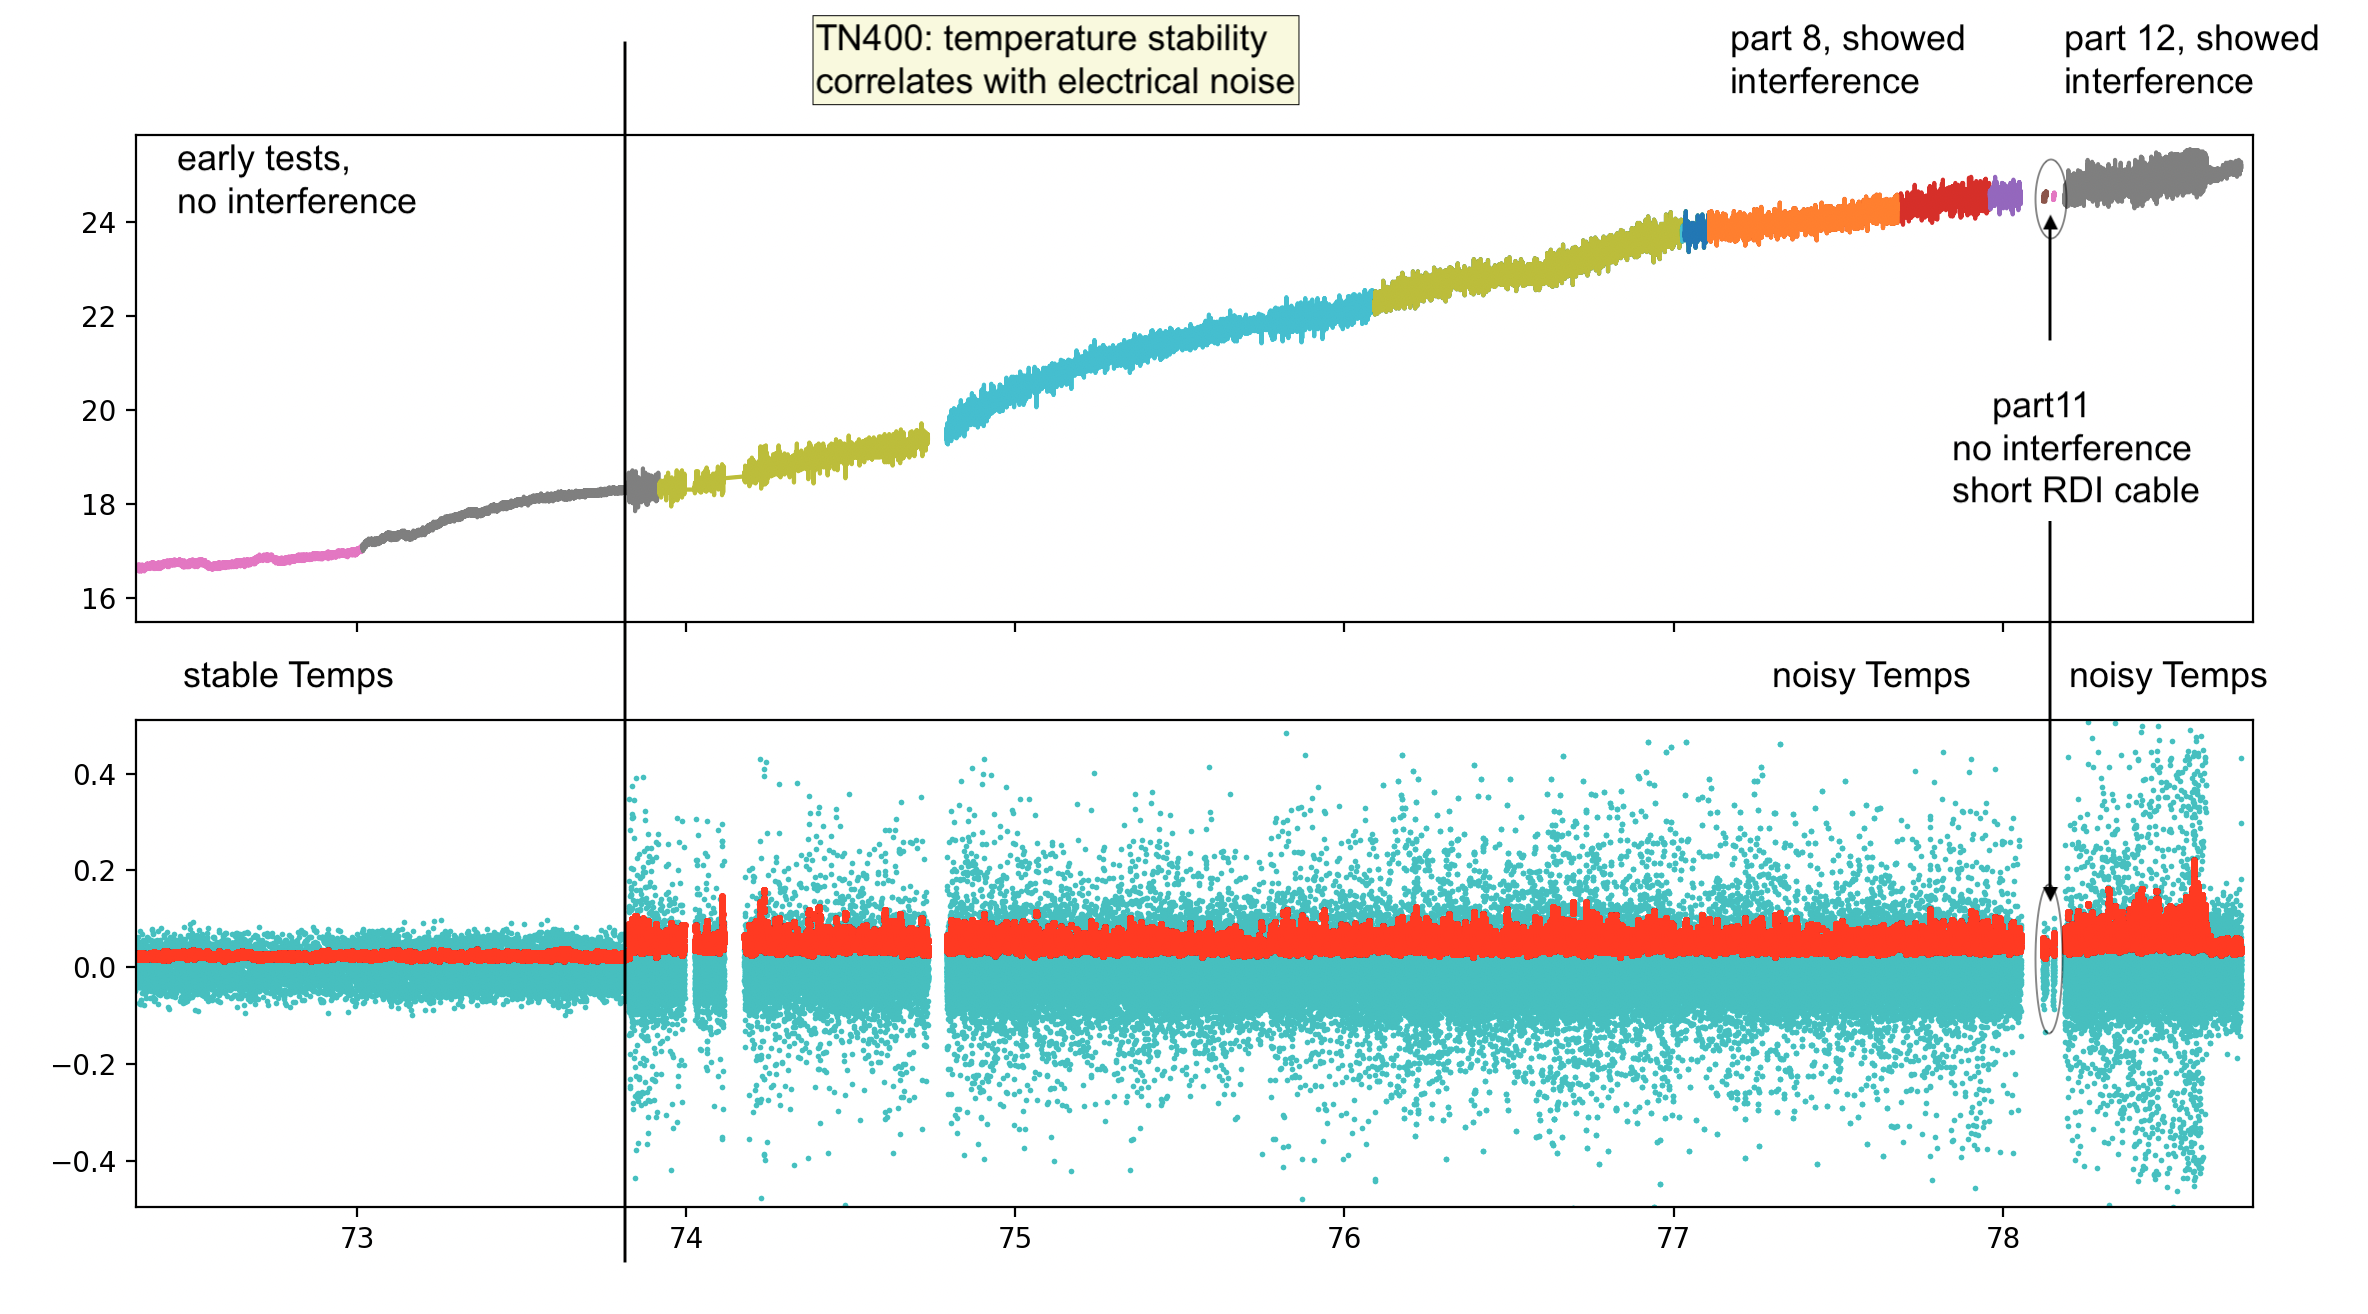
Plotting the temperature for the whole cruise showed that when we did not see interference, the temperature deviations were very small. But when interference was present, the temperature deviations were larger. This was particularly striking in the last short-cable test. The temperature deviations before and after the short-cable test were high (when the long cable was used and the electrical interference was obvious). But during the short-cable test, when no interference was visible, the temperatures were stable.

(full size: TN400 temperature and interference)
This figures shows OS75 temperature in the top panel, with each separately-logged data segment (Part08, Part10, etc) in a different color. The second panel has detrended temperature (cyan) and a running (31-point) standard deviation in the lower panel. Of note: (1) stable temperatures at the beginning, when we conducted Test2 (which did not show interference) (2) sudden onset of noisy temperatures about decimal day 73.8 (unknown cause) (3) briefly stable temperatures during Test3(C), "part 11".
Note
Larger versions of the same figures are below.
Figures

(full size: test1 beam 1 velocity and speed)
(full size: test 1, segment 1, beam velocities)
(full size: test 1, segment 2, beam velocities)
(full size: test 2 segment 1, beam1 velocities)

(full size: test 2 segment 2, beam1 velocities)

(full size: "part08" discovery of interference)
(full size: "part08" discovery: beam velocities and processed data )
(full size: "part10" test 3A - beam1 velocity)
(full size: "part11" test 3B - 4 beams, no interference)
(full size: "part11" test 3B - beam 1, no interference)

(full size): "part12" test 3C - beam 1, and processed