Navigation
Previous topic
How to write set_cast_params.m
Next topic
Data to bring back from the cruise
How to write set_cast_params.m
Data to bring back from the cruise

Type 1: U and V at station 56 during I5S 2009. Made with /home/science/I5S_2009/web/plot_profiles.m.

Type 2: Longitude-depth sections of U and V during I5S 2009. Made with /home/science/I5S_2009/web/plot_U_V_depth_longitude.m.
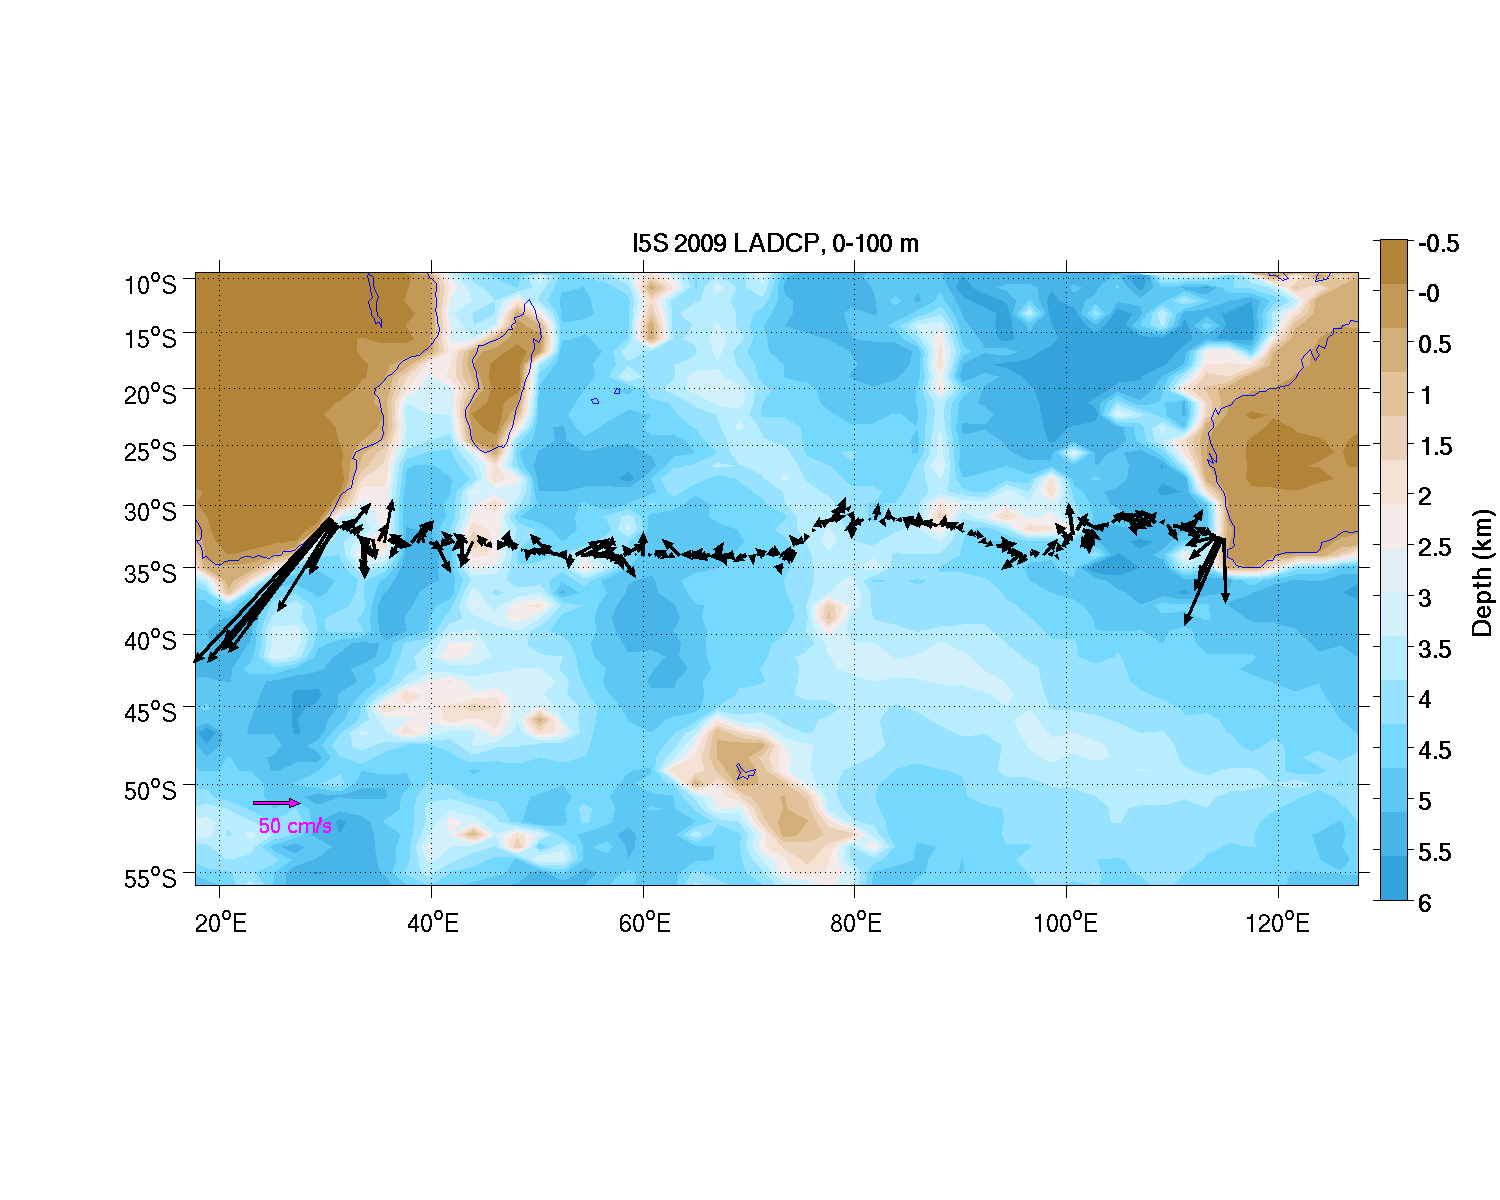
Type 3: Top view of horizontal velocity averaged between the surface and 100 m during I5S 2009. Made with /home/science/I5S_2009/web/make_vector_plot.m.

Type 4: Technical plots. Especially the third and fourth panels show the tilting (rotation around a horizontal axis) and heading (rotation around the vertical axis) of the rosette, respectively. This is Fig. 2 of the LDEO processing