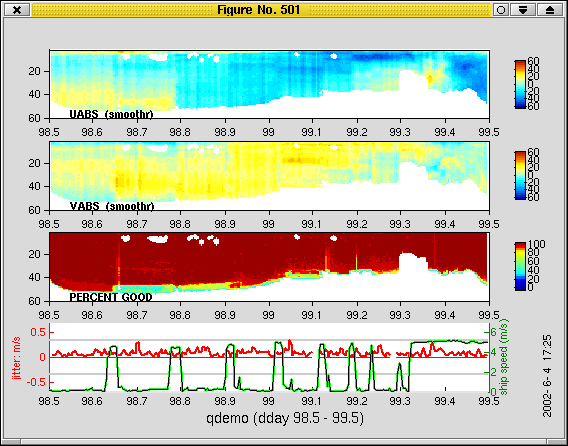
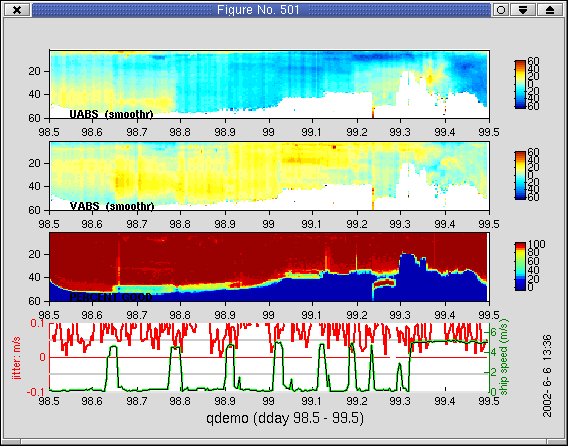
These data come from the original demo. They demonstrate a scale factor error (corrected by fixing temperature) and wire interference (from high on-station error velocities).
Look for the following as you compare figures:
- In the first stage, temperature had not been corrected, leading to an error in scale factor, which shows up as stripes when on station
- In the first and second stages, spots of anomalous velocity exist near the surface while on station (caused by wire interference).
(Thumbnails are linked to annotated figures) First, they were scanned and loaded, but no rotation was been applied.

Second, the temperature was corrected
Last, editing was applied