These data come from edemo, a cruise on the Ron Brown in Aug/Sept 2001. They illustrate the figures you can see with gautoedit. They also show the effect of the editing. These figures were made with a rotation of -3.6deg (see rotation misalignment discussion ).
With the defaults applied, there are four figures available in gautoedit: (thumbnails are linked fullsized images)
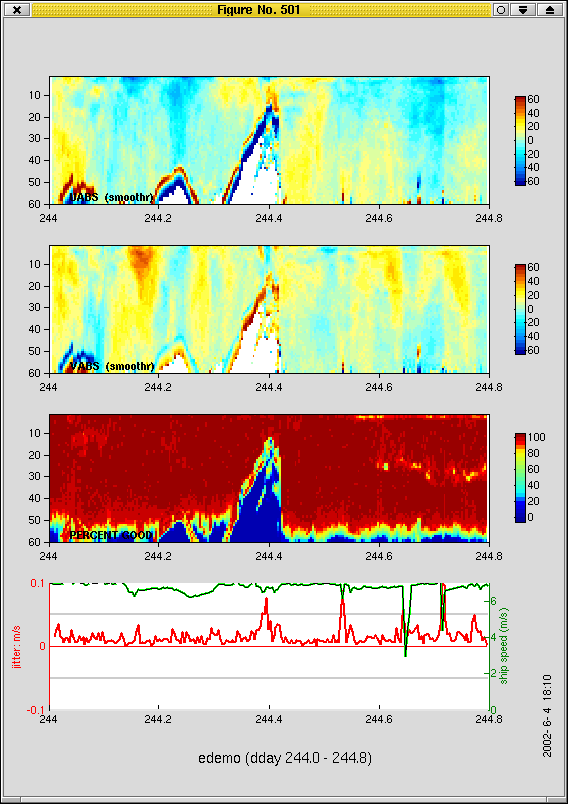
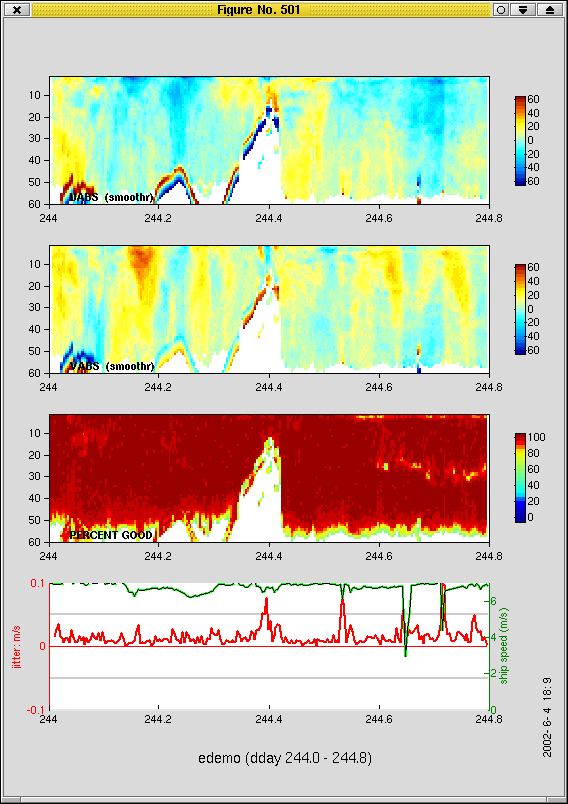
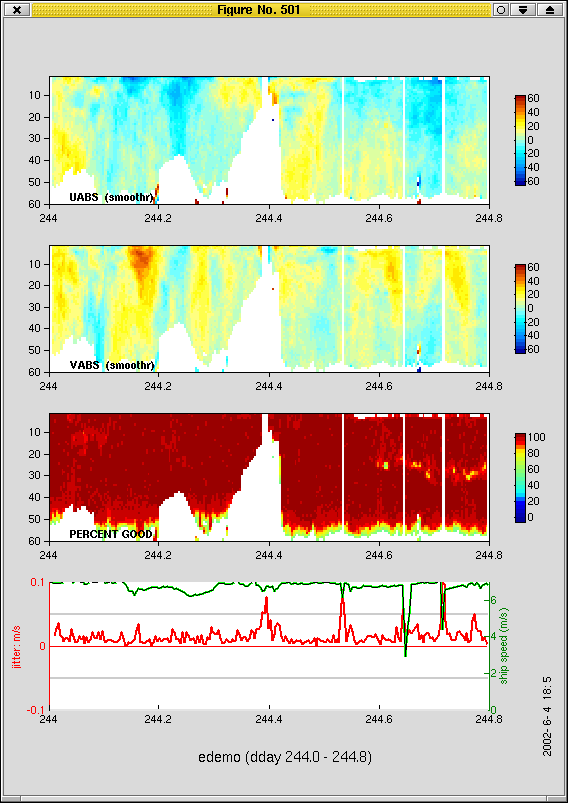
Standard U,V, PG, ship speed |
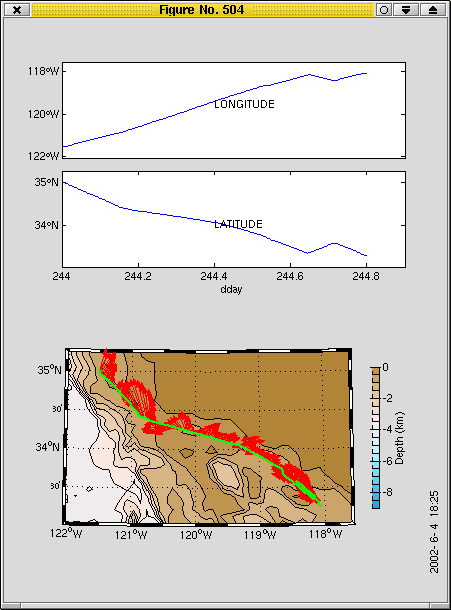
vector plot on topography |
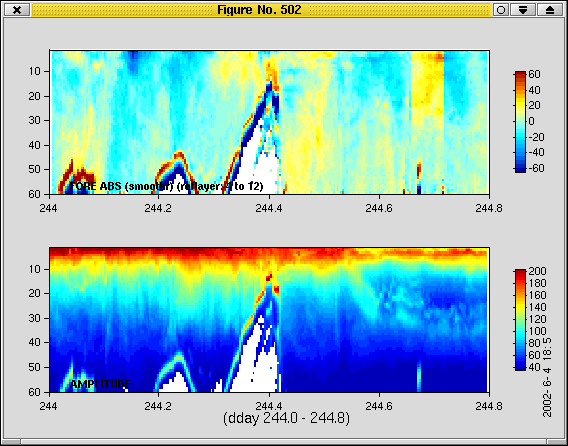
amplitude and forward velocity |
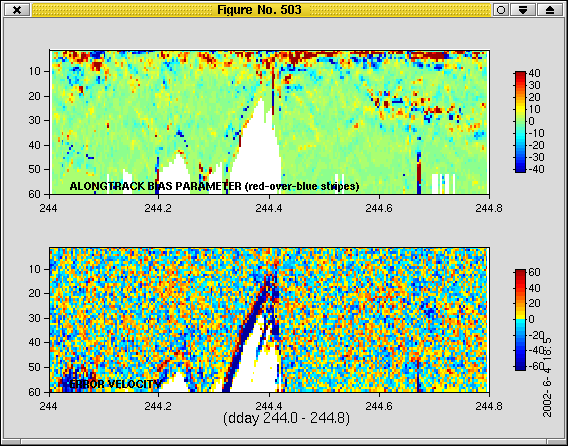
error velocity and bias parameter |
In gautoedit for the first time, after a quick_adcp.py setup, you can select different amounts of editing to see:
|
|
after you’ve: - applied editing - rerun nav steps - rerun gautoedit _after-autoedit|_ |