2.8.6. Understanding the “Jitter” Parameter
Note
Jitter was a parameterization invented when we were using Matlab for processing. With Python processing, it is not necessary. Therefore weconsider it OBSOLETE. If you have to use “jitter” for editing, you should reprocess with Python and things will improve.
“Jitter” is a measure of how much smoothing (of the navigation) was required by refsm. You can think of it as a running standard deviation of velocity adjustments, in cm/s.
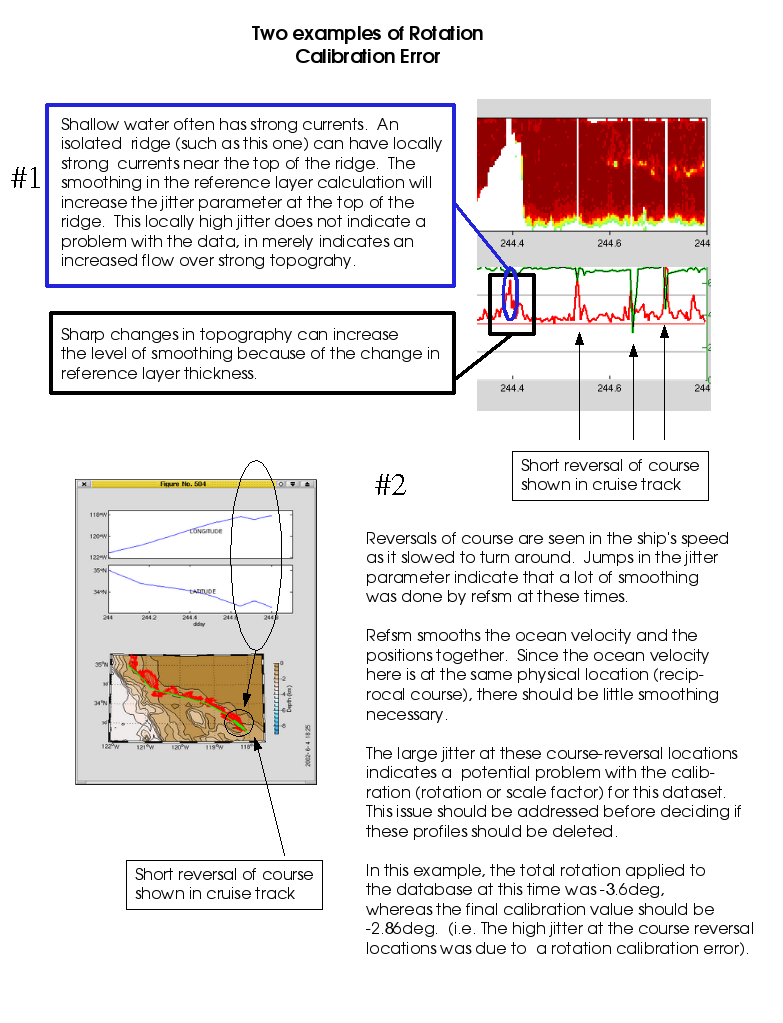
A high level of jitter indicates either rapidly changing velocities or navigational noise. Rapidly changing velocities can be real (such as over shallow or steeply sloping topography), can be induced by a calibration error (such as a residual phase adjustment), or can be a good indicator of geninely bad data (such as in ice). Noise in the navigation can indicate a bad position (for whatever reason), or can indicate noisy positions in general (selective availability and p-code GPS have very different inherent jitter levels).
Guidelines: This parameter is really meant as a way to identify potentially bad profiles.
Defaults: The current default is reasonable for p-code GPS positions and 5-minute averages. Cruises with dithered GPS (such as the demo) or shorter averages (eg. WH300 with 2-minute averages) may require over 30.
Approach: Set the jitter threshold at a level where it is only flagging the outliers and then look to see whether you can actually see a visible difference between the flagged profiles and their neighbors. If all the flagged profiles are anomalous in some way, then the jitter criterion did its job and you should ‘list to disk’ with that threshold. If you do not want to delete the profiles flagged, the best approach is to raise the threshold (so the profiles are not flagged) and then use “delete bad times” to manually delete the profiles.
Other adjustments: see neighbors
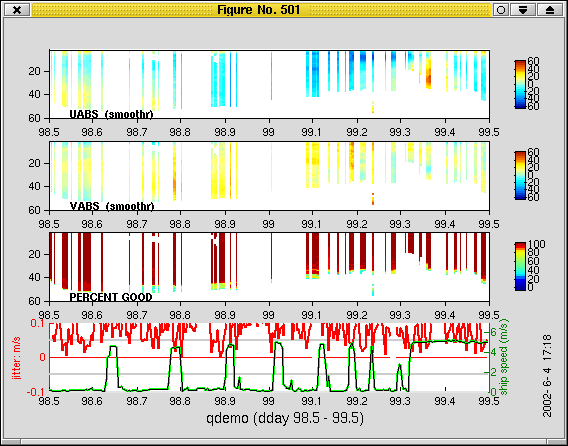
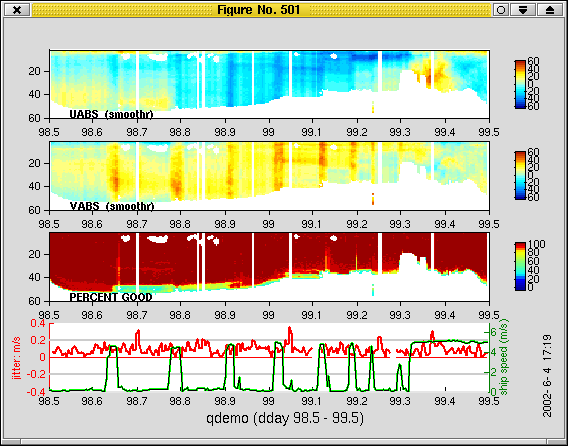
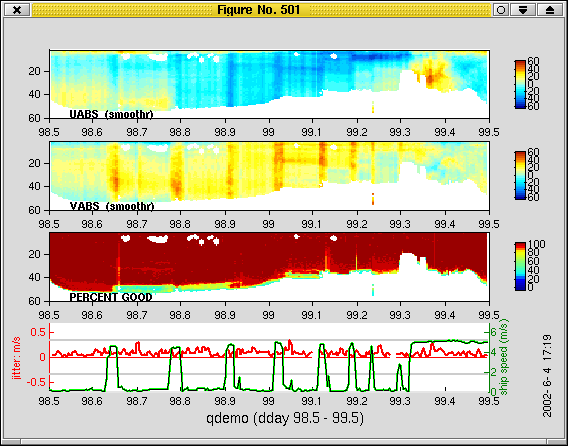
From the original demo, you can see the number of flagged profiles decrease as the jitter criterion is raised. The original demo did not have p-code GPS positions. There are no particular spikes in jitter associated with the on-station/underway transition or with the time on station (as opposed to underway). The stripes in velocity are due to an amplitude calibration error not yet fixed at this stage in processing.
(thumbnails are linked to larger versions)
jitter threshold is 5 |
jitter threshold is 20 |
jitter threshold is 35 |
(thumbnails are linked to larger versions.)
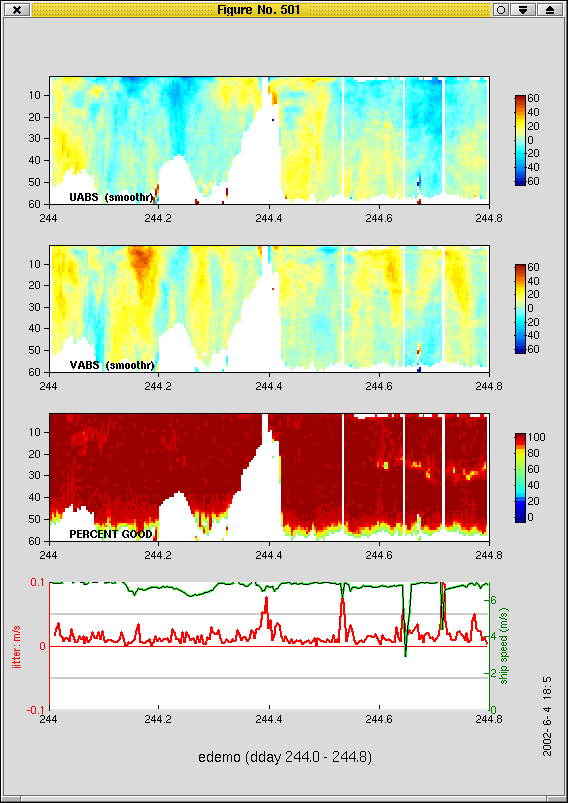
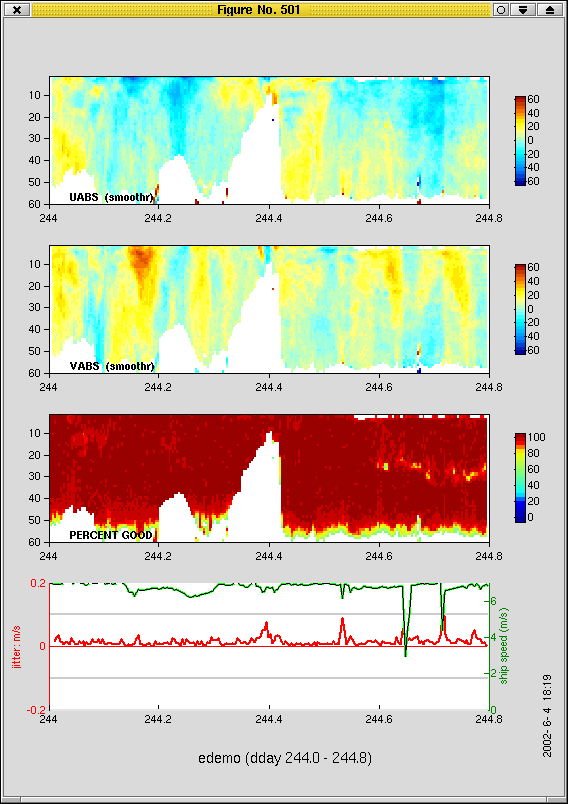
From the newer dataset, we get two illustrative examples of jitter. In this illustration, the total rotation applied to the database is -3.6deg (but the final calibration shows the value should be -2.86dg). The fullscale pictures (left panel) shows the jitter threshold flagging profiles over a shallow spot (at about 244.4) and three spikes after that. Raising the jitter threshold removes the flagging (center panel).
jitter threshold is 5 |
jitter threshold is 10 |
explanation |