3.3. Monitoring
This page has three sections:
3.3.1. Status: Monitoring at Sea
- At sea, there are three categories of monitoring:
ADCP processing (example: ocean velocity profiles)
health of the components (ADCP, accurate heading device)
data acquisition (hung processes, serial connections)
ADCP processing:
The UHDAS web site at sea has a collection of figures that update regularly. They should be monitored to ensure that the timestamps are updating (i.e. the processing did not stall).
At sea, these are on the Quick Links: Figures link on the UHDAS home page.
-
These are updated frequently at sea. Two annotated examples of the profile plots show cases with
Note
The profile plots should have a data timestamp not more then 10 minutes old.
-
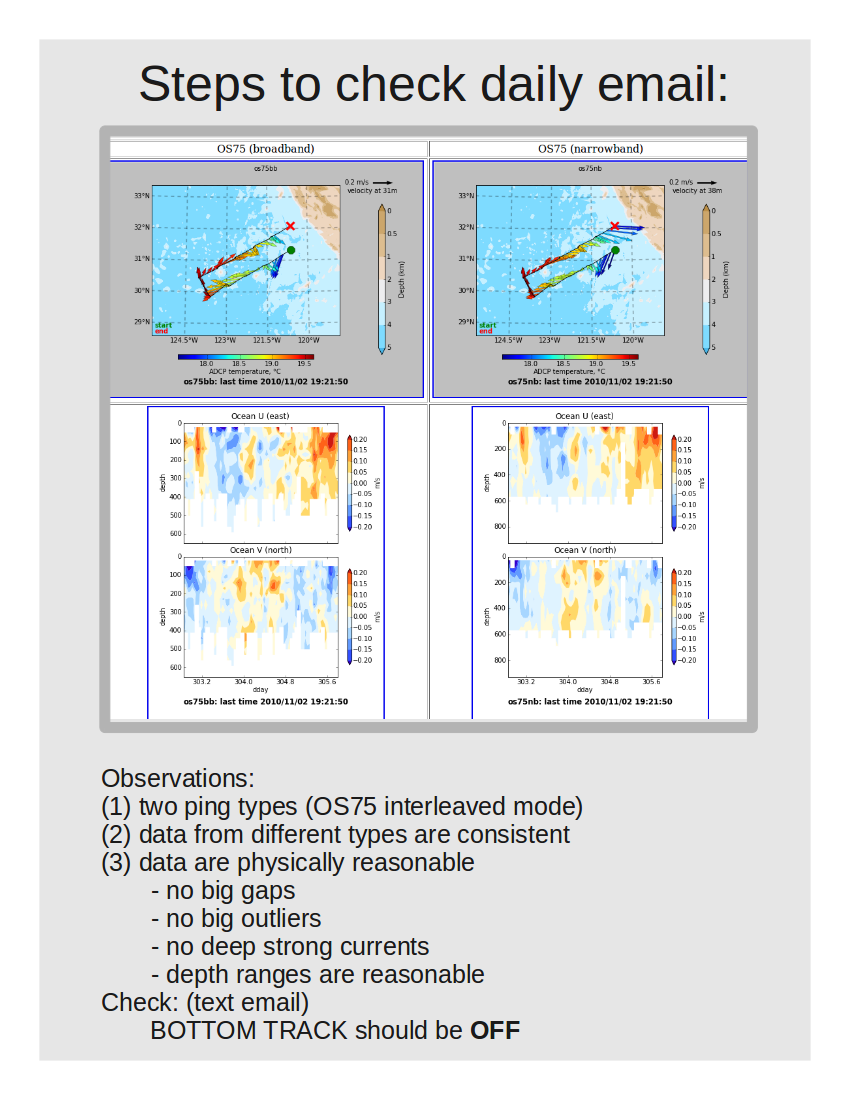
These are updated every 30 minutes. In general, if the 5-minute profile plots are updating, the contour and vector plots will also update on time. These plots are most useful in providing context for science and operations.
Plots like these are generated on land from a data snippet sent in the daily email, so a person on land or at sea can view the last 3 days of ADCP data.
The contour and vector plots should have a data timestamp not more then 40 minutes old.
-
health of the components:
heading correction
If the ship has an accurate heading device as well as a gyro, UHDAS will keep track of the difference between the two, and plot it. An accurate heading device might be Ashtech, POSMV, Seapath, Phins, Mahrs, or other.
There have been various generations of these plots, as we learn better how to display the heading correction in a way that will be useful with different devices. These are examples for
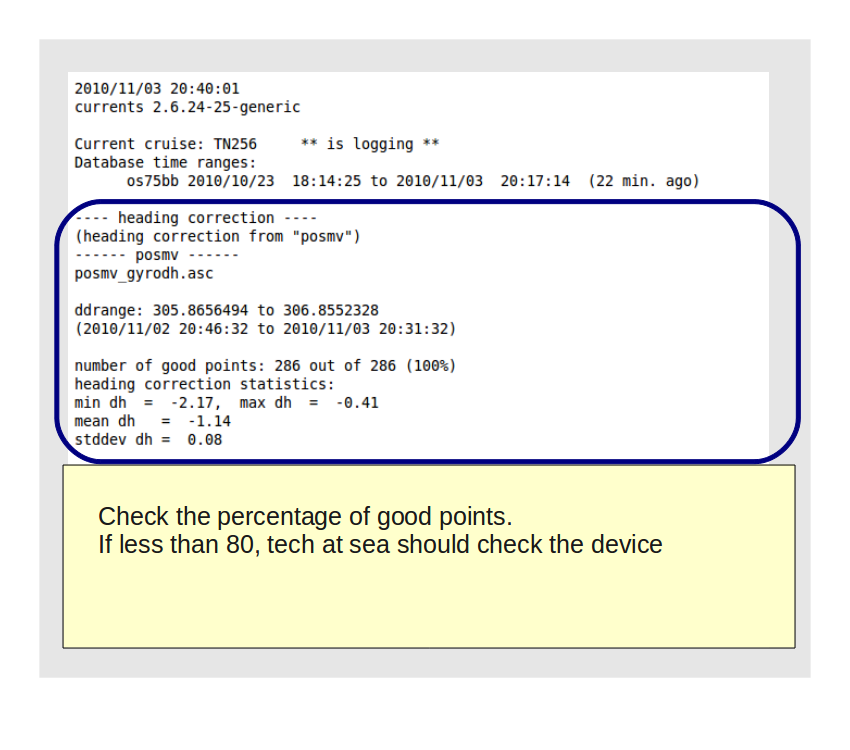
Not all of these instruments have QC indicators, hence quality indicated from plots and statistics may be unrealistically optimistic. The daily text email includes an estimate of quality (summary statistics) for the accurate attitude devices specified. The exact format of the statistics generated varies slightly between UHDAS installations, as we try to better tune the information. An example of the statistics generated for the above three figures is here.
Note
The most likely failure for an accurate heading device is when an Ashtech loses its ability to track the satellites. If the Ashtech is yielding bad headings for more than 30-60 minutes, it may need to be reset. See the Troubleshooting section for more detail about Ashtech errors and how to recognize them.
data acquisition:
On the UHDAS computer console, “green is good” for the logging status.
If a cable falls out or a feed quits coming in, the bar turns red (“red is rubbish”).
Note
Green only means a valid checksum was returned. There is no parsing or quality-checking done in the GUI. Example: Ashtech can have bad or missing data and a green bar.
(Return to TOP)
3.3.2. Status: Daily Email – Monitoring from Shore
On land, there are two basic mechanisms for monitoring.
daily text email: Once per day, an email is sent from each ship to parties on shore containing a summary of information about the status of the processing and data quality. A similar email goes out to ship’s tech email account.
daily email attachment to Univ Hawaii: An separate email is sent with a collection of diagnostic information and heavily averaged sample of the last 3 days of processed ADCP data from each of the ADCP+pingtype data. The figures generated from the data are a potent diagnostic tool. The text email (above) is stored as one of the files in the collection of diagnostic files.
The entire collection of diagnostic files is available for troubleshooting for anyone with a WWW connection
Daily text email:
The text email is designed to provide enough information to determine at a glance whether everything is working or not. If there is a problem, the next step is to look at the files sent in the diagnostic collection. These files are supposed to provide sufficient information to decide what action should be taken.
The daily text email contains the following information:
time (when the email was generated)
cruise status (active? no cruise set?)
processing status (is the CODAS database recent?)
attitude devices (statistics of accurate heading devices)
- computer information
how long has the computer been running? recently rebooted?
NTP time server: found?
a link to the figures generated from the data
a summary of warnings and file ages
Diagnostic Files
The diagnostic files attempt to provide sufficient information to tell if something is going wrong and what the problem is (or where to look for it).
This table show the file names and the categories of various files.
The most useful files are:
status_str.txt: This is the text email summary, described above.
DAS_main.txt: recent status (stop logging, start logging, etc)
tails.txtContains the last 12
timestamps and serial messages for each NMEA instrument (and ADCP log)
times and sizes of raw logging files
times and sizes of rbin files
times and sizes of gbin files
commands_*.txt: present settings (ADCP commands)
cals.txt: ongoing output of watertrack and bottomtrack calibration calculation.
ashtech_gyro_pystats.txt: quality of ashtech (similar names for other devices; these files are contained in the text email)
3.3.2.1. Daily text email: Tutorial
The first page of a text email looks like this:
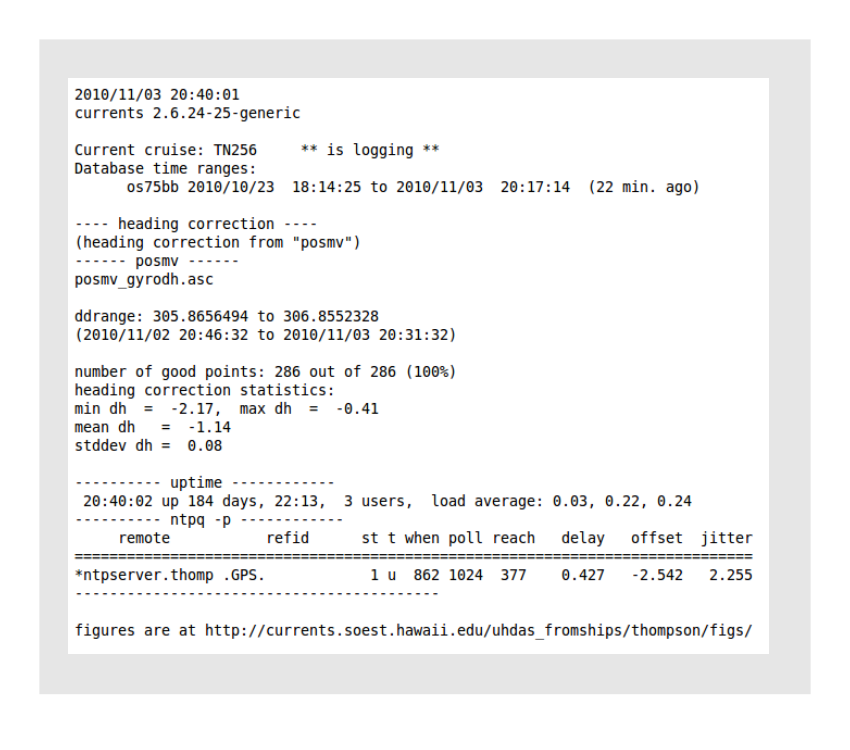
The next set of images will step through the parts of the email and how to read them
time (when the email was generated)

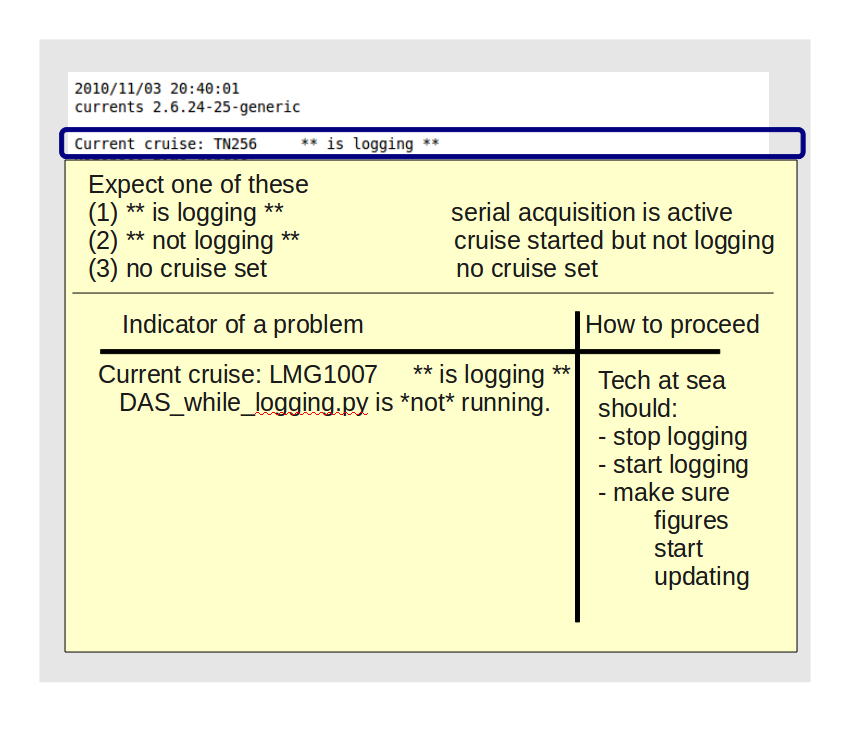
cruise status (active? no cruise set?)
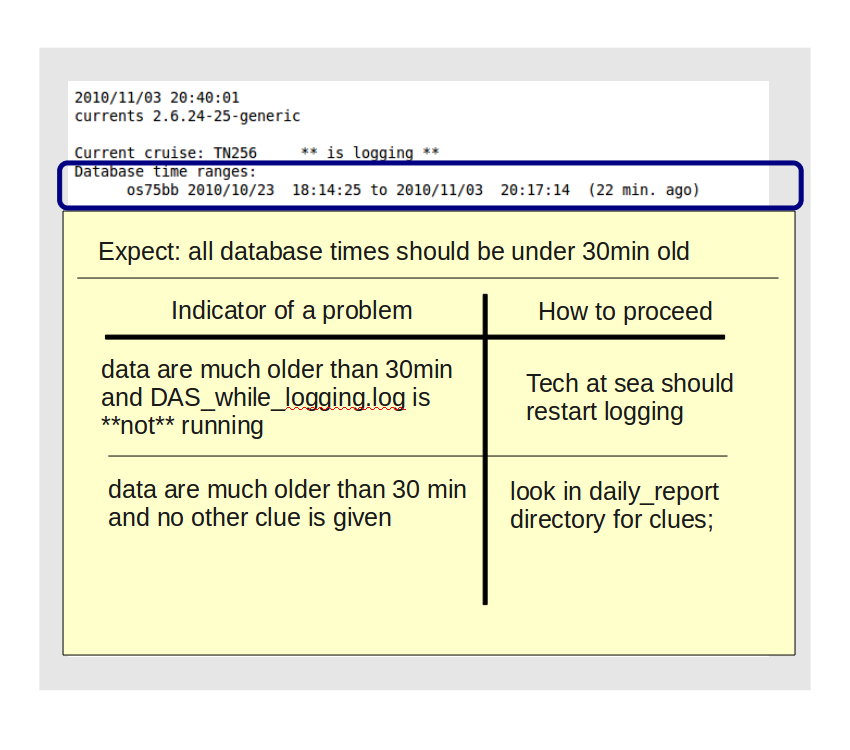
processing status (is the CODAS database recent?)
attitude devices (statistics of accurate heading devices)
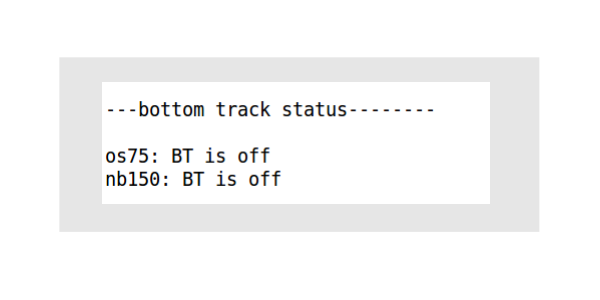
bottom track
Newer installations say whether bottom track is on or off. Bottom track should be OFF if the bottom is out of range. Keep this in mind when you look at the figures. Are they in deep water with bottom track on?
- computer information
how long has the computer been running? recently rebooted?
NTP server: found?
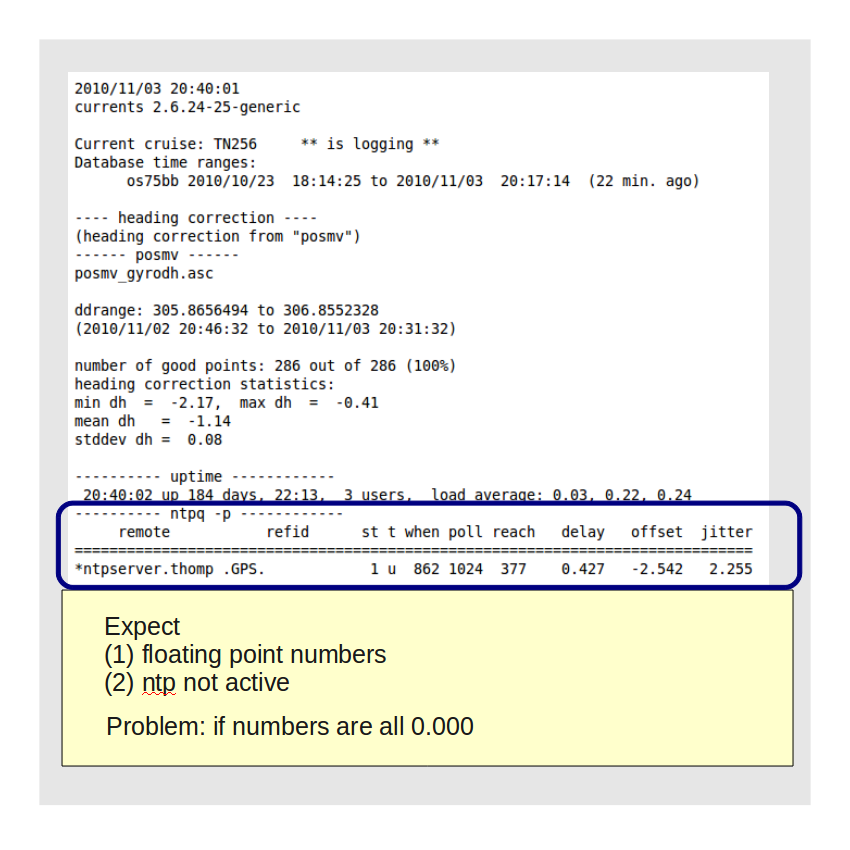
- check the link
go look at the figure
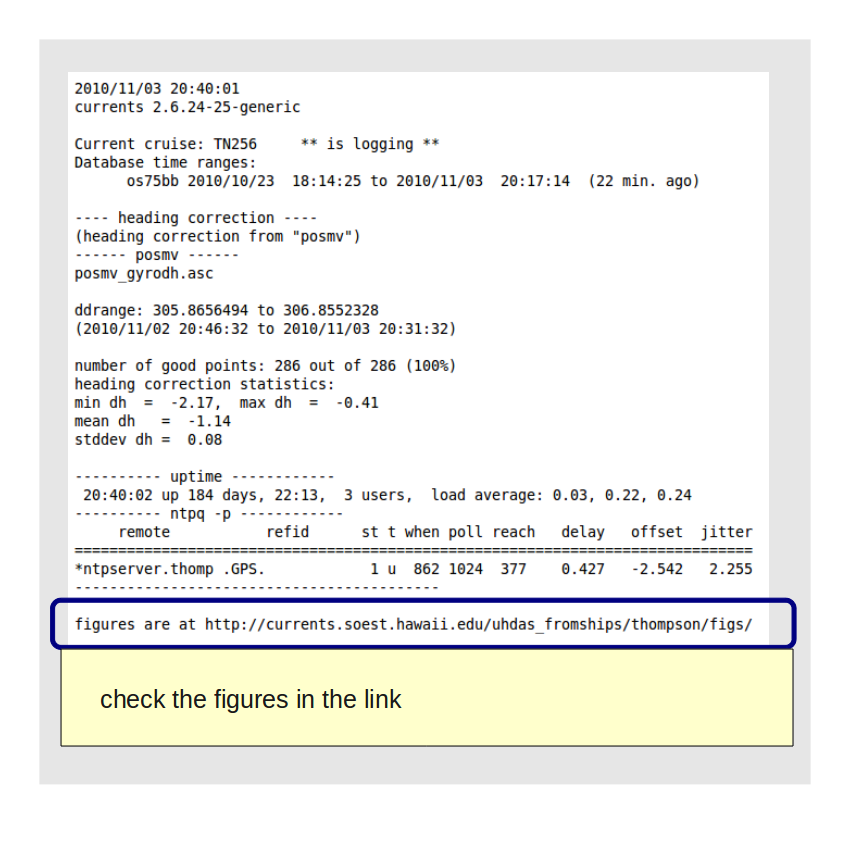
checking the WWW figure
3.3.2.2. Daily text email: Indications of Trouble
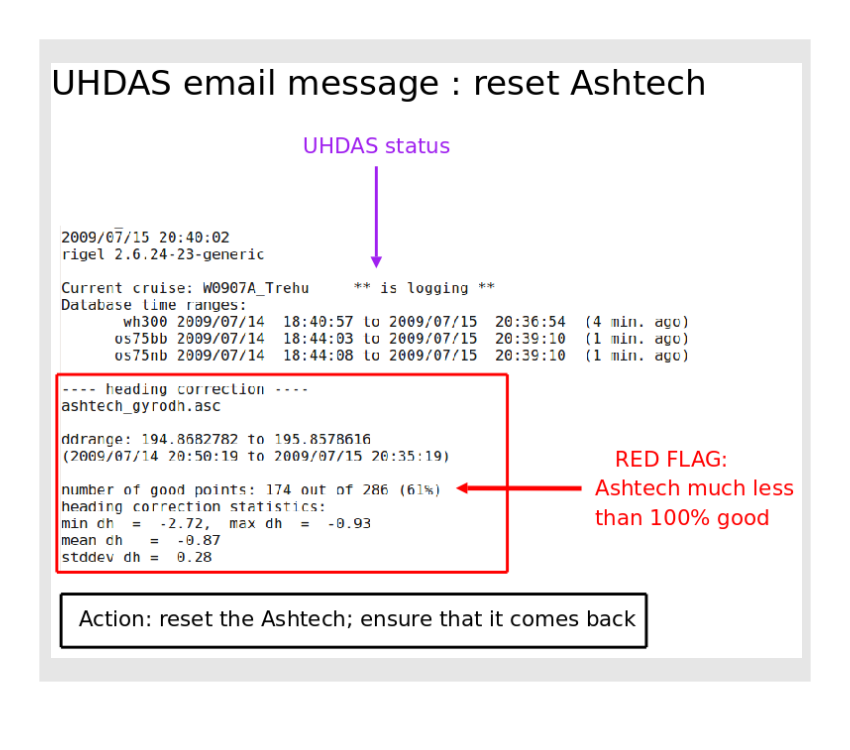
3.3.2.2.1. Reset Ashtech
All too common. Everything is fine with the UHDAS system, but the Ashtech has performed badly over the last day. Check the messages to see if it is down. Reset the Ashtech.
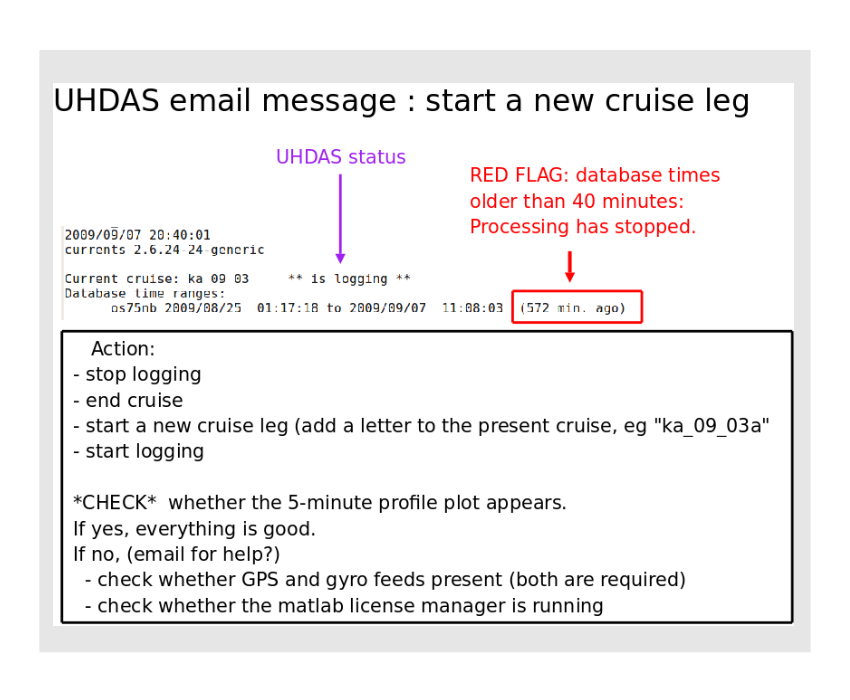
3.3.2.2.2. Processing stopped: cause unknown
Troubleshooting is required to understand the cause. It is most likely to be a problem with the timestamps. Look in the diagnostic files to see whether all the files are updating as expected. The most likely solution is to start another named cruise segment.
3.3.2.2.3. Kernel bug: “restart logging”
In this case, a simple “stop logging”, “start logging” is sufficient

(Return to TOP)
3.3.3. Ticketing Flags
UHDAS has a ticketing system that automatically parses the daily email and the status files and prepends warnings and flags to the daily email. If you are a UHDAS Ticketing user, these are the flags that are automatically generated and presented in your daily email. Otherwise you have to scrutinize the files to find the problems.
Categories of automated warnings
(1) data quality
poor heading quality of accurate heading device
ADCP temperature spiking (impending instrument failure)
GPS time was repeated or stepped backwards
GGA messages are all commas
gaps in incoming data
(2) problems with acquisition or data feeds
expected process is not running
database is old (but should be up to date)
zmq_publisher.py should be running but is not
(3) instrument or processing settings
calibration out of spec
expected feed is missing
configuration file on ship does not match Master List
configuration file is internally inconsistent
incorrect ADCP settings
bottom track on in deep water
triggering results in too few pings
data from ADCP#1 is logged with ADCP#2’s settings
software configuration (eg. error during installation setup)
cables swapped
(4) networking, computer health
backup failed
disk not found
disk space running out
I/O error on disk
expected email did not come
problem with ntp time server
time server not used; computer clock drifted
processes taking too long
computer swapped (“spare” computer is logging data)
USB errors
other random errors (EDAC, URB)
(Return to TOP)